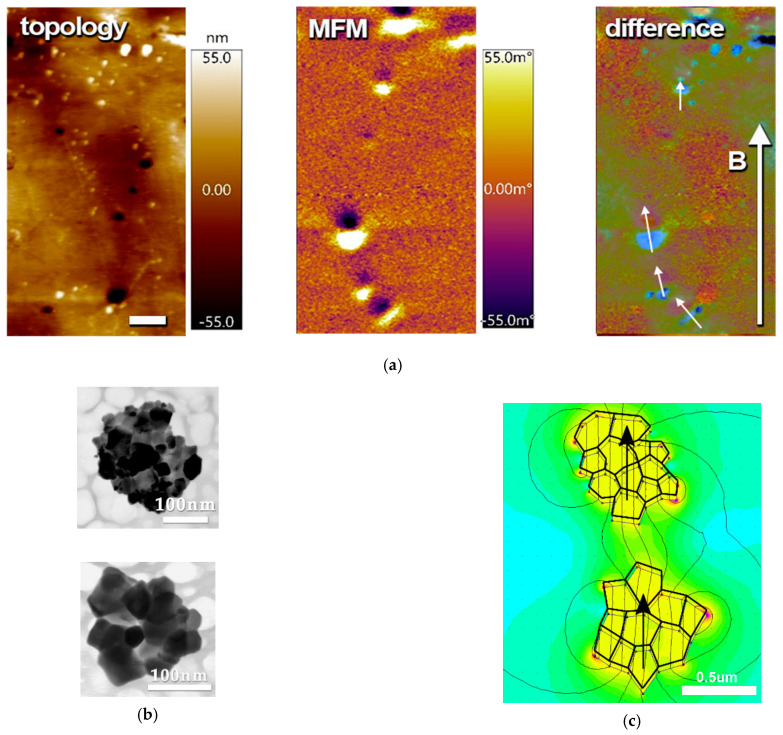
Figure 6.
(a) Magnetic force microscopy (MFM) images of PVDF-TrFE/CFO nanocomposite: topology, MFM signals, and their difference. Arrow B indicates the direction of the applied magnetic field during polymerization. Scale bar is 2 μm; (b) TEM image of separated aggregates of powder CFO NPs; (c) illustration of a possible configuration of two aggregates and simulated magnetic field distribution for this configuration.

