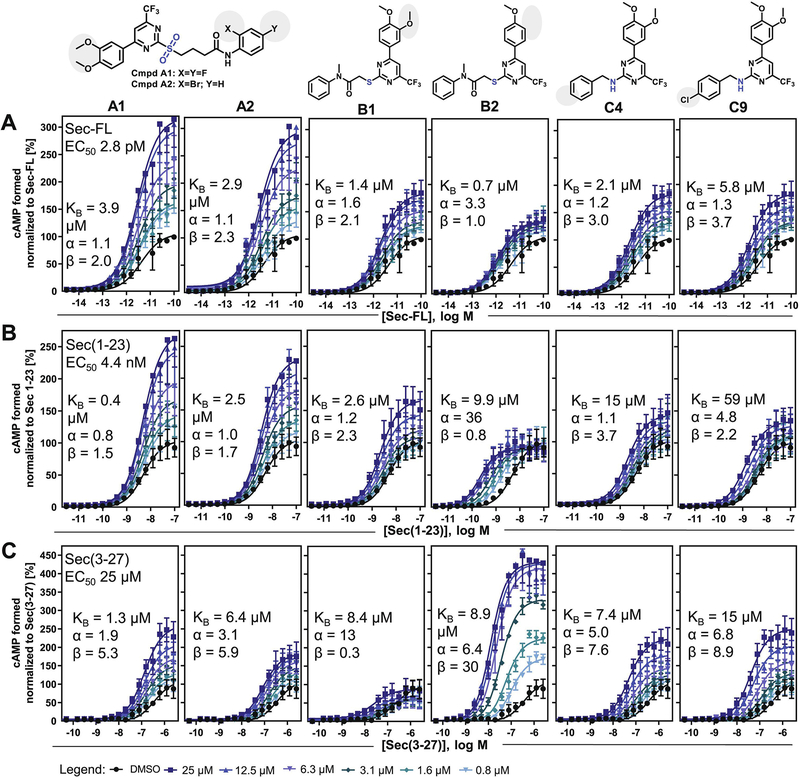
Figure 1: Modulator titration reveals allosteric activity profiles dependent on distinct orthosteric ligands:
cAMP dose-response curves of (A) Sec-FL, (B) Sec(1–23), (C) Sec(3–27) on SCTRs treated with DMSO or six increasing concentrations of compounds (from left to right: A1, A2, B1, B2, C4 and C9) ranging from 0.8 to 25 μM; TR-FRET ratios converted to cAMP concentrations and normalized to corresponding orthosteric ligand; allosteric activity parameters KB, α and β were determined using the complete operational model of allosterism in GraphPad Prism; experiments were performed in duplicate in three independent experiments and data points are shown as mean ± SEM. For select compound concentrations only below error bars are shown for illustrative purposes.

