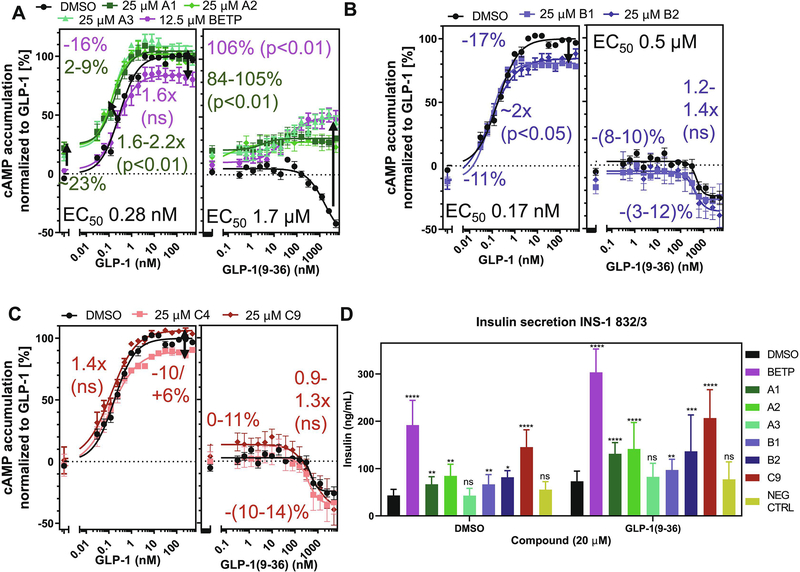
Figure 6: Select SCTR PAMs potentiate stimulatory and insulinotropic effects in pancreatic rat insulinoma cell line:
cAMP dose-response of (A, B, C, left to right) GLP-1 and GLP-1(9–36) in INS-1 cells treated with DMSO (black), 12.5–25 μM of (A, B) BETP (purple) or 2-sulfonyl pyrimidines A1 (dark green), A2 (light green), A3 (light blue-green), (C, D) 2-mercapto pyrimidines B1 (light blue), B2 (dark blue) or (E, F) 2-amino pyrimidines C4 (light red), C9 (dark red); TR-FRET ratios resulting from cAMP accumulation normalized to GLP-1; graphs plotted using GraphPad Prism; experiments performed in duplicate in at least three independent experiments; data points shown as mean ± SEM. Statistical significance determined using GraphPad Prism’s unpaired t-test corrected with Holm-Sidak method. (D) Increase of insulin secretion compared to DMSO (black) in DMSO or GLP-1(9–36) co-treated INS-1 cells with 20 μM of BETP (purple), A1 (dark green), A2 (light green), A3 (light blue-green), B1 (light blue), B2 (dark blue), C9 (red) or negative control compound (NEG CTRL, beige); TR-FRET ratio resulting from insulin secretion converted to insulin concentration (ng/mL) per source well and plotted as bar graphs using GraphPad Prism 8.4.0.; experiments were performed as quintuplicates in three independent experiments and data is presented as mean ± SD; statistical significance was determined using ordinary two-way ANOVA and Tukey’s multiple comparisons test (99% confidence interval). P values were illustrated according to the following classification: (*p = 0.01–0.05), (**p = 0.01–0.001), (***p = 0.001–0.0001), (****p < 0.0001).

