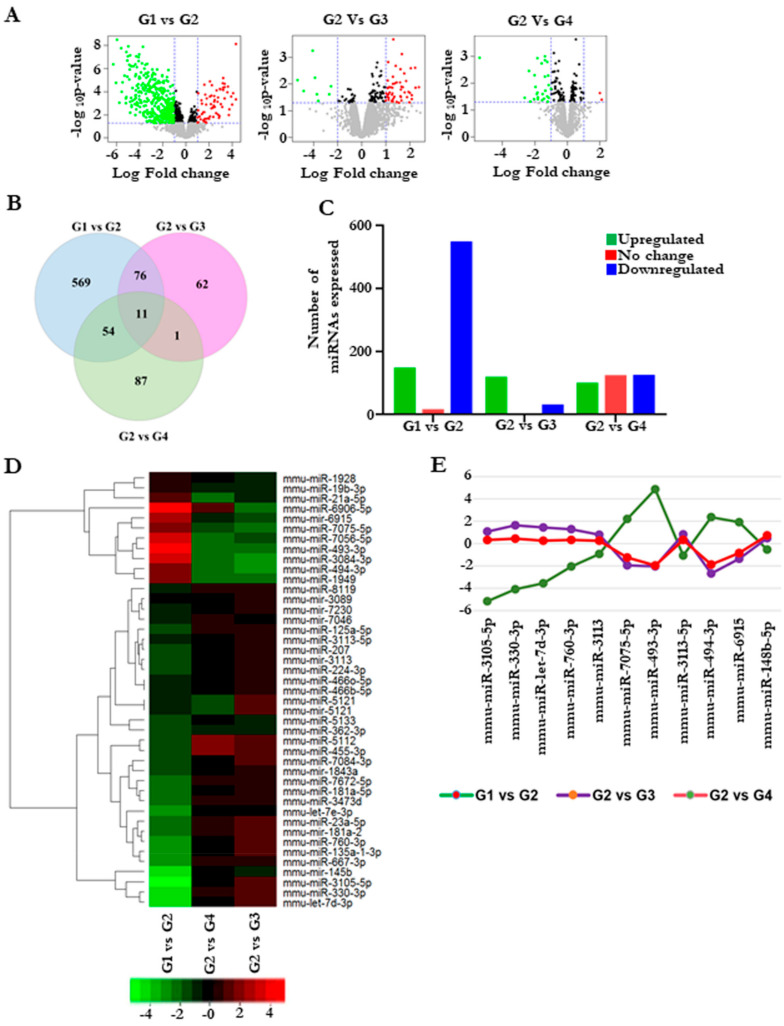
Figure 5.
Cardamonin altered miRNA expression in colitis-induced colorectal cancer model. Group 1 (untreated normal control) was compared with group 2 (the vehicle control), and group 2 was further compared with groups 3 and 4 (the cardamonin-treated groups). (A) Volcano plot of the differentially expressed miRNAs from the microarray analysis of colon tumor samples. The abscissa represents the log2 transformation value of the differential expression as fold change. The y-axis represents the −log10 of the p-values. The x-axis represents the log fold change and is measured as the log2 transformed ratio of the expression between different experimental groups (G1 vs. G2; G2 vs. G3 and G2 vs. G4). Green dots represent significantly downregulated miRNAs, while red dots represent significantly upregulated miRNAs. (B) Venn diagram showing the total miRNAs overlapping between the groups. (C) The number of miRNAs expressed between different groups. (D) Heat map plot representing the differentially expressed miRNAs with the highest standard deviation (p ≤ 0.10). The first column comprises G1VsG2, and the second and third columns comprise G2VsG4 and G2VsG3, respectively. (E) Graph showing selected miRNA expression intensity values (log scale) between the groups.

