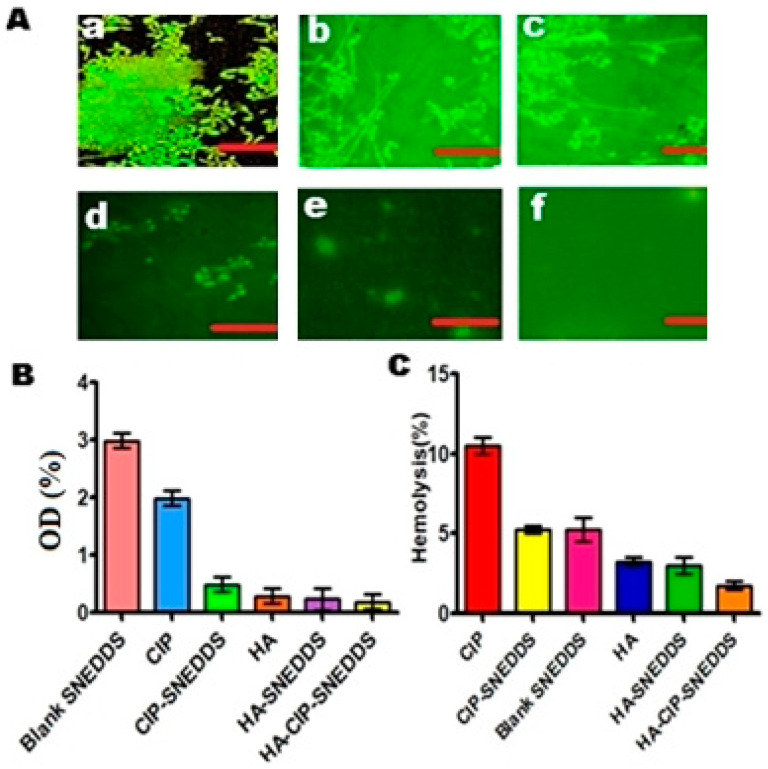
Figure 6.
(A) Fluorescence imaging of FITC-tagged Salmonella typhi biofilms showing the Blank (a), CIP (b), CIP-SNEDDS (c), HA (d), HA-SNEDDS (e), and HA-CIP-SNEDDS (f) growth inhibition of biofilms by treating with SNEDDS (* Scale bars: 50 μm). (B) S. typhi biofilm dispersion graph of various formulations, (C) Determination in vitro hemolysis (%).

