. 2019 Dec 5;11(4):1043–1051. doi: 10.1039/c9sc05469c

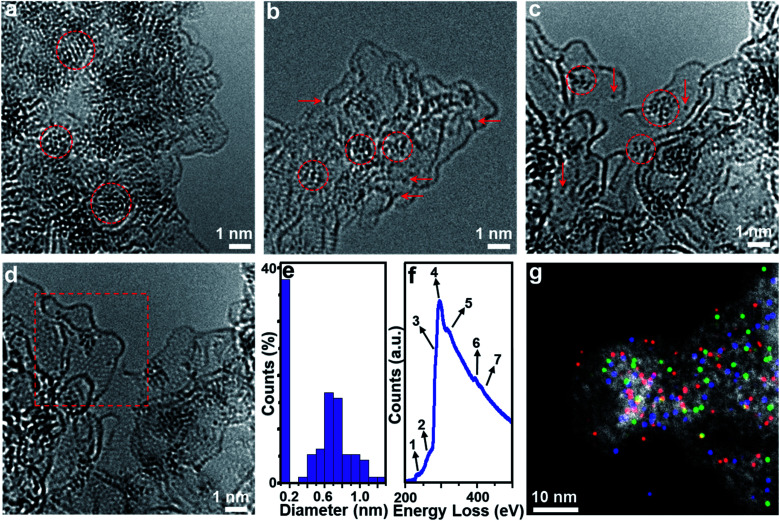
Fig. 1. Morphologies and chemical structures of composites 1, 2 and 3. (a–d) Aberration-corrected HRTEM images of 1 (a), 2 (b) and 3 (c and d). In (b) and (c), the arrows and the circles show [Mo-oxo]n clusters with different metal atoms. (d) shows the same area as that of (c) with different focal lengths to visualize the graphitic structure of the carbon in the framed area. (e) Size distribution histograms obtained from TEM images of 3. (f) EELS spectra (background subtracted) recorded from the HAADF-STEM image. Peak assignments for elements: 1 = Mo-M5, 2 = Mo-M4, 3 = C-sp3, 4 = C-sp2, 5 = C-ELNES (carbon fine structure electron loss near the edge structure), 6 = Mo-M3, and 7 = Mo-M2/N–K. (g) HAADF-STEM and corresponding overlaid EDS mapping of 3, showing the homogeneous dispersion of Mo (red), P (green) and N (blue).

Fig. 1