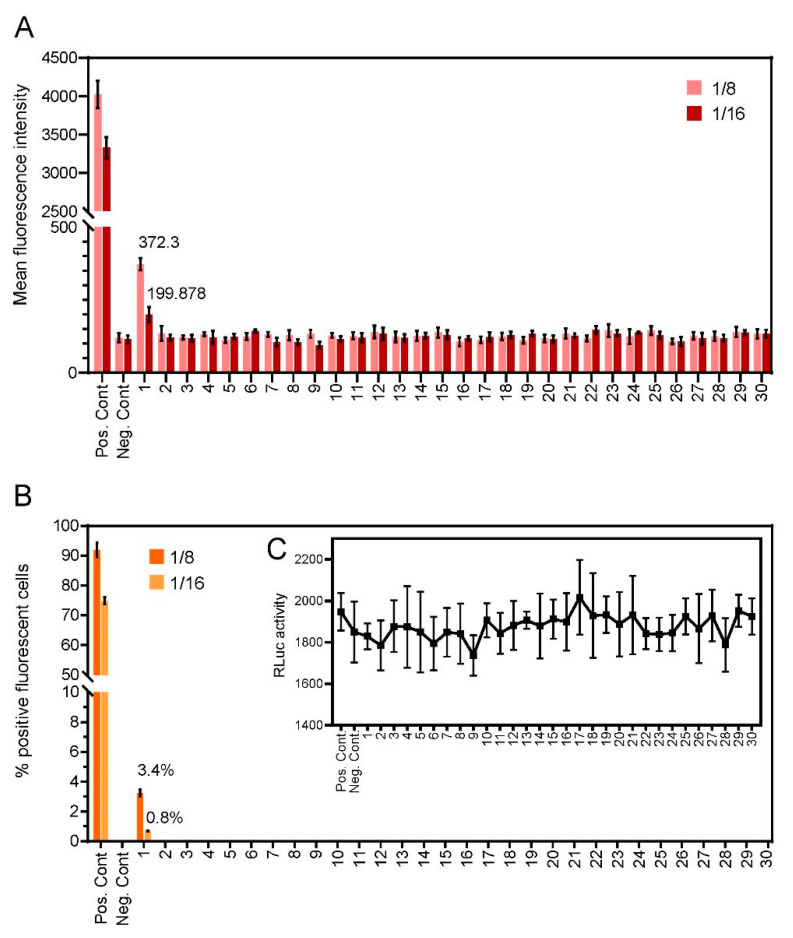
Figure 4.
Levels of anti-SARS-CoV-2 IgG antibodies detected through the C19-S-I-IFA assay in the sera from thirty volunteer donors. (A) Bar heights represent mean fluorescence intensities for each dilution. (B) Percentage of fluorescent positive cells. (C) RLuc was used as an internal transfection control. Bar heights represent the mean of two biological replicates: error bars show SEMs.

