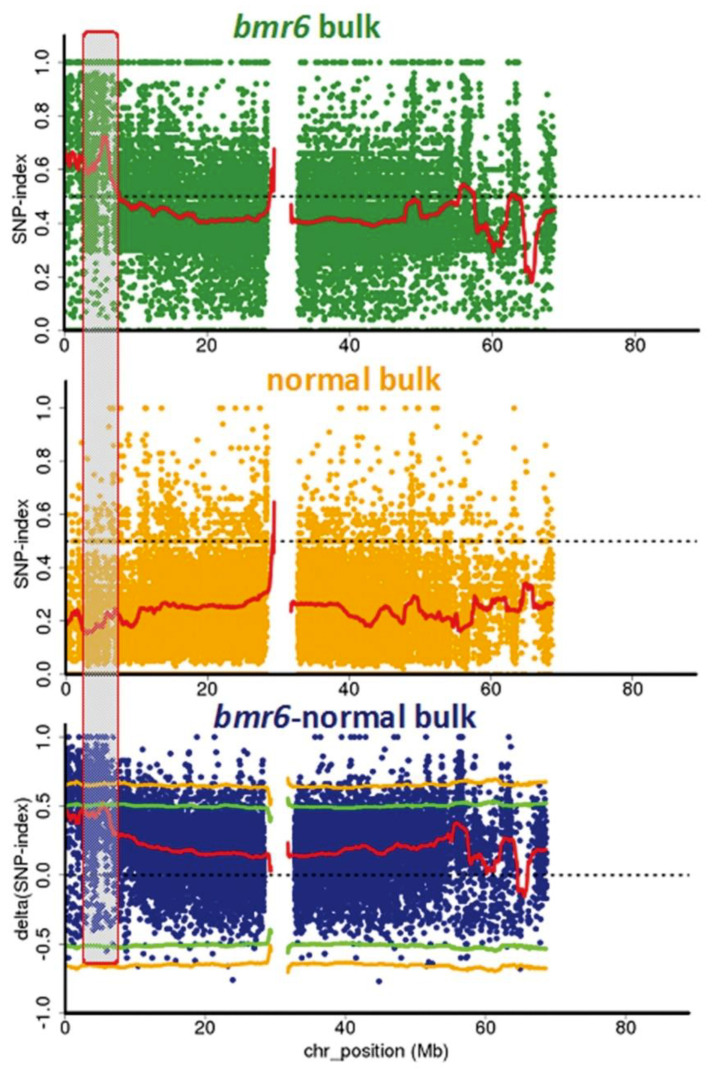
Figure 2.
Single nucleotide polymorphism (SNP) analysis to identify bmr6 mutation. SNP index plots of bmr6 bulk (top), normal bulk (middle) and Δ(SNP-index) plot (bottom) of sorghum Chromosome 4 with statistical confidence intervals under the null hypothesis of no QTLs (green, p < 0.05; yellow, p < 0.01). Grey highlighted area shows the QTL near the beginning of Chromosome 4 where the significant difference between the bulks occurs.

