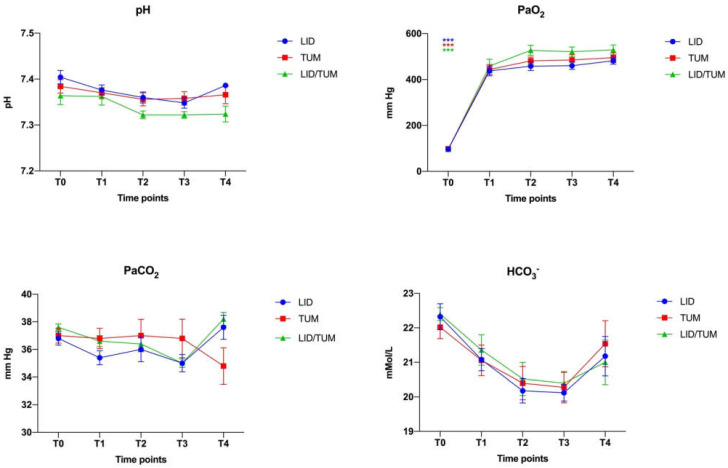
Figure 5.
Mean values ± standard error of arterial blood pH, arterial oxygen tension (PaO2) arterial carbon dioxide tension (PaCO2) and bicarbonate concentration (HCO3−) during anesthesia in the three groups. Groups, LID: Group Lidocaine; TUM: Group Tumescent anesthesia; LID/TUM: Group Lidocaine/Tumescent anesthesia. Time points, T0: immediately after the introduction of the arterial catheter; T1: immediately after the start of the surgery; T2: 15 min after the start of surgery; T3: 30 min after the start of surgery; T4: 40 min after the start of surgery. Asteriks indicate significant differences between groups: ***: p < 0.001.

