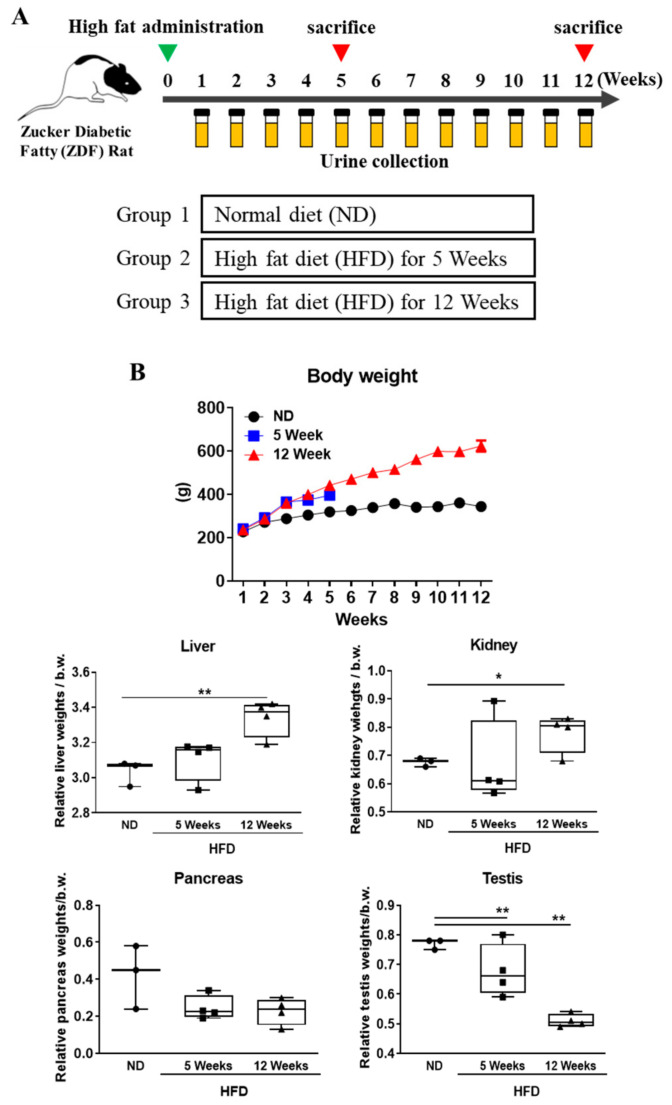
Figure 1.
Experimental design and body weight and organ weight changes. (A) Zucker diabetic fatty rats were divided into three groups (normal diet group, high fat diet groups (5 and 12 weeks)). Urine samples were collected from all subjects weekly. (B) Body, liver, pancreas, and testis weight were measured in each group. All results showed changes in relative organ weight ratio (%) at indicate time point. Data are expressed as the mean ± SD of each group. * p < 0.05; ** p < 0.01; ND, normal diet; HFD, high-fat diet.

