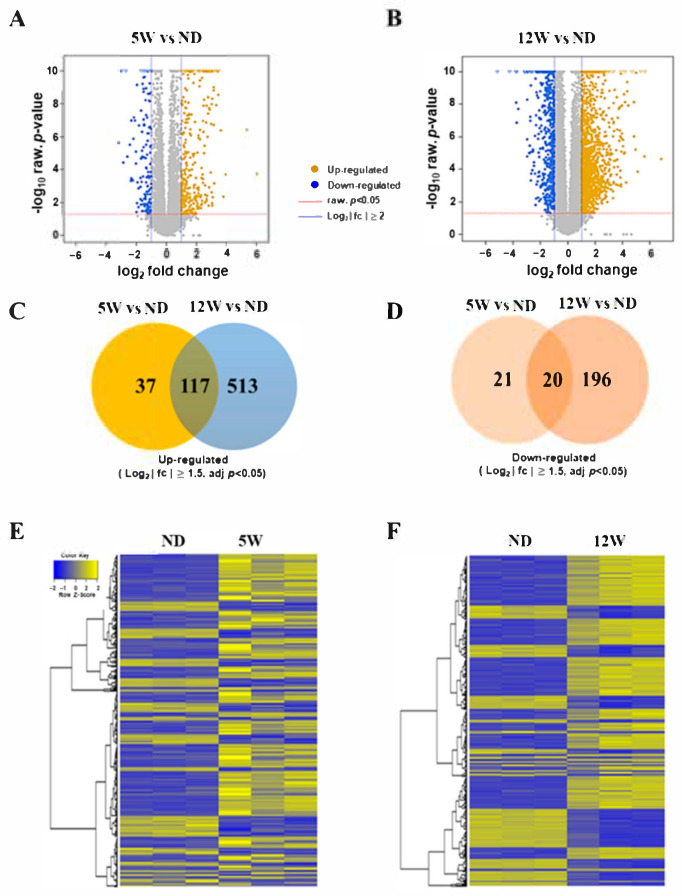
Figure 4.
Differentially expressed mRNAs in the renal cortex of the DN rat model. (A) Volcano plot for comparison between 5-week-HFD group and normal-diet (ND) group (5 W vs. ND). In the right of the graph, yellow color is indicative of the up-regulated expressed gene (log 2 FC > 2 and FDR < 0.05); in the left of graph, blue color is indicative of the down-regulated gene (log 2 FC > 2 and FDR < 0.05). The gray points indicate mRNAs that were not statistically significant (FDR > 0.05). (B) Volcano plot for comparison between 12-week-HFD group and ND group (12 W vs. ND). (C) Up-regulated differentially expressed genes (log 2 FC > 1.5, FDR < 0.05) in the comparisons between 12 W vs. ND and 5 W vs. ND. (D) Down-regulated differentially expressed genes (log 2 FC > 1.5, FDR < 0.05) in the comparisons between 12 W vs. ND and 5 W vs. ND. (E,F) Differentially expressed genes (FDR < 0.05) in diabetic rat and normal tissue were analyzed using hierarchical clustering. Each row represents a single mRNA and each column represents one tissue sample. FC, fold change; FDR, false discovery rate; mRNA, messenger RNAs; ND, normal diet; HFD, high-fat diet; 5 W, 5 weeks; 12 W, 12 weeks.

