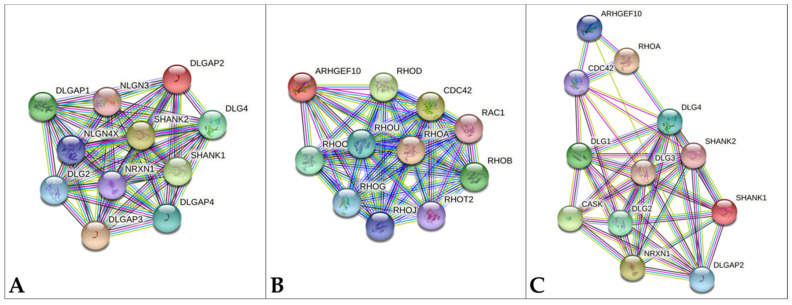
Figure 2.
Protein-protein interaction in STRING database [57]. (A) DLGAP2 network, (B) ARHGEF10 network (C) ARHGEF10 and DLGAP2 common network. The top ten interactors for each gene are shown. Colored lines indicate different kinds of interactions. Blue: known interaction from curated databases; violet: known interaction experimentally determined; green: predicted interaction for gene neighborhood; red: predicted interaction for gene fusion; dark blue: predicted interaction for gene co-occurrence; yellow: interaction based on text mining; black: interaction based on gene-expression; light blue: interaction based on protein homology.

