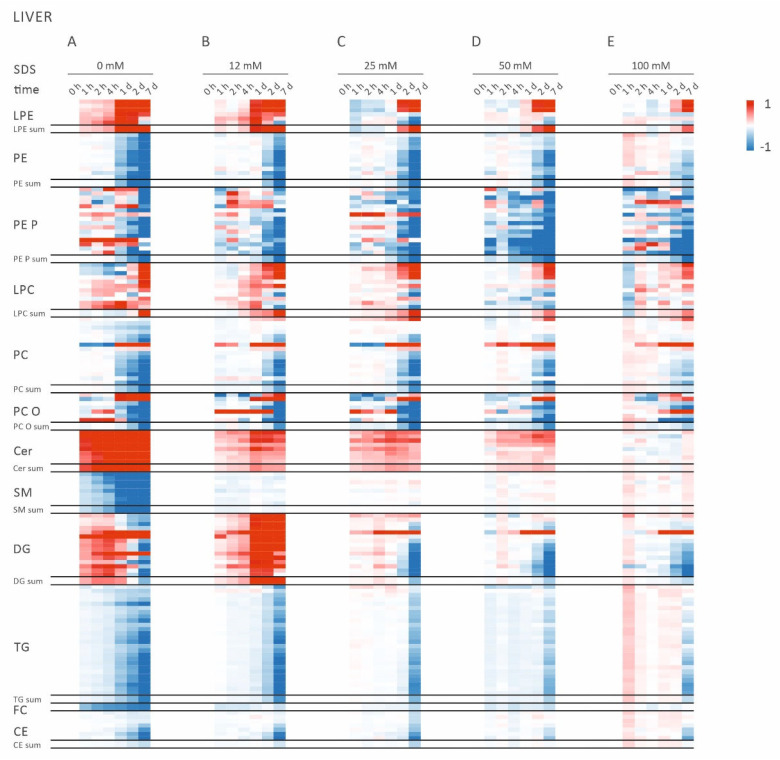
Figure 1.
Heat maps showing the results of the lipidomic analysis of liver homogenates stored at room temperature for the indicated times. The color scale visualizes the log2-fold change relative to the control sample (0 h) of each group. Values <−1 were set to −1 and values >1 to 1. Samples were stored in methanol/water (50/50, v/v) without SDS (A) and with 12 mM SDS (B), 25 mM SDS (C), 50 mM SDS (D), or 100 mM SDS (E). CE: cholesteryl ester; Cer: ceramide; DG: diglyceride; FC: free cholesterol; LPC: lysophosphatidylcholine; LPE: lysophosphatidylethanolamine; PC: phosphatidylcholine; PC O: PC ether; PE: phosphatidylethanolamine; PE P: PE based plasmalogens; SDS: sodium dodecyl sulfate; SM: sphingomyelin; TG: triglyceride.

