. 2019 Nov 18;11(2):456–466. doi: 10.1039/c9sc04367e

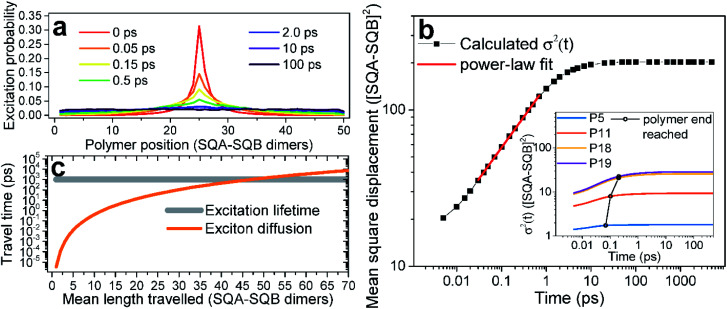
Fig. 6. Anomalous exciton diffusion. (a) Explicitly simulated spatial exciton probability distribution as a function of time for a hypothetical P50 polymer. The cusp shape is characteristic for sub-diffusive behavior. (b) Dynamics of the mean square displacement σ2(t) (black squares). Note the double-logarithmic scale. The red line indicates a power-dependence fit with a nonlinear coefficient of α = 0.4. The inset contains the mean square displacement for the shorter P5, P11, P18, P19 polymers, investigated experimentally. The black line connects the points where the exciton reaches the polymer ends, as determined by taking the first derivative of the σ2(t) and looking where it drops to half its maximum value. (c) The time it takes the exciton to travel a given mean path (orange). The point where the curve intersects the exciton lifetime (indicated in gray) determines the exciton diffusion length, which is in our polymers about 44 SQA–SQB dimers.

Fig. 6