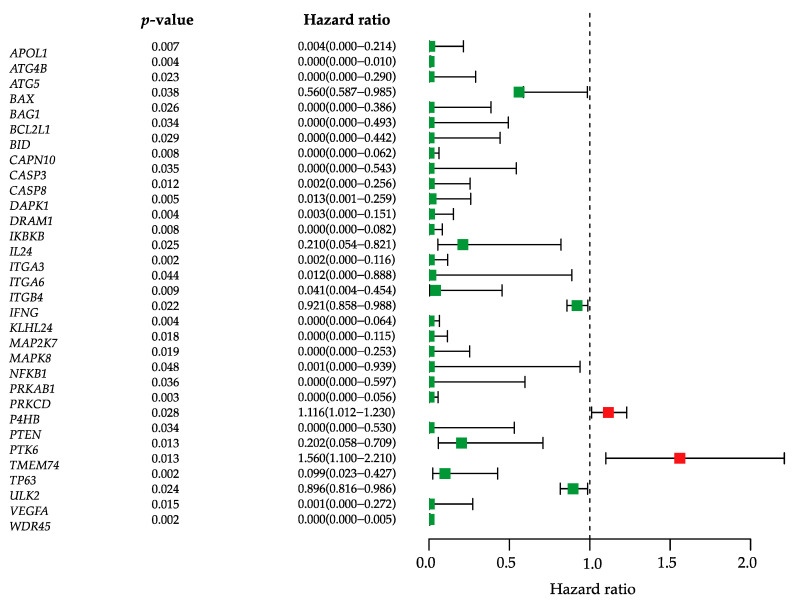
Figure 1.
Identification of prognostic autophagy-related genes. Univariate Cox regression analysis obtained 32 ARGs. The hazard ratio forest plot shows the prognostic value of each gene. Green squares represent genes with hazard ratio <1, while red squares represent genes with hazard ratio >1. Horizontal lines are 95% CIs.

