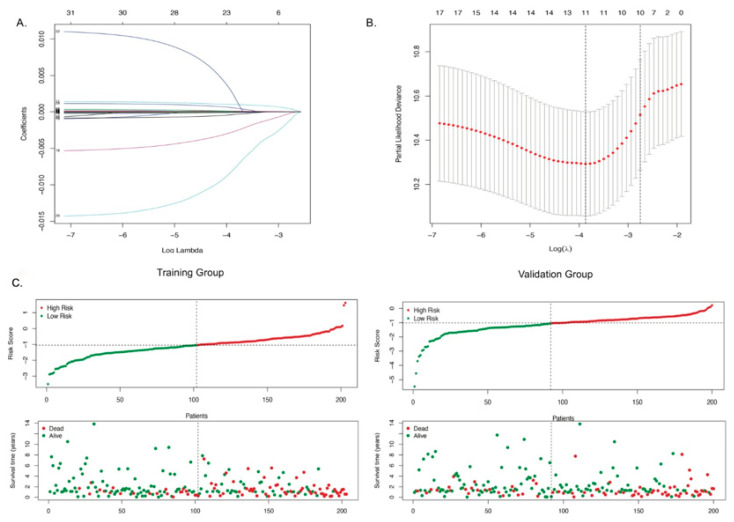
Figure 3.
Expression profile and prognostic value of ARGs. (A) LASSO coefficient spectrum of 11 genes in BLCA. The coefficient distribution map was generated for a logarithmic (λ) sequence. (B) Selection of the best parameters for BLCA in the LASSO model (λ). (C) Distribution of prognostic index (upper panel) and survival status of patients (lower panel) in different groups.

