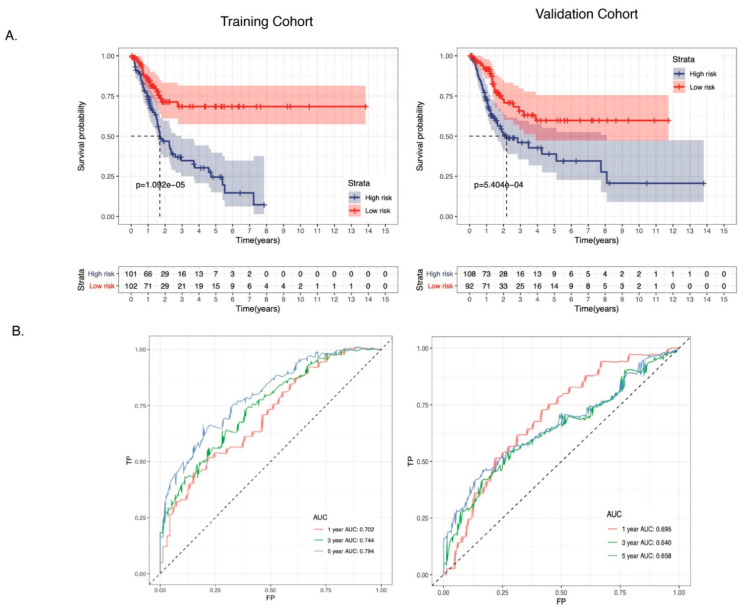
Figure 5.
Evaluation of the 11-gene ARG signature in TCGA training and validation cohorts. (A) The Kaplan–Meier survival curve analysis revealed a shorter overall survival in the high-risk group. The blue line represents the high-risk group. The red line represents the low-risk group. (B) Survival-dependent ROC curves validated the prognostic significance of ARGs-based prognostic indicators. The red line represents the 1-year AUC; the green line represents the 3-year AUC; and the blue line represents the 5-year AUC. ROC, receiver operating characteristic; AUC, the area under the ROC curve.

