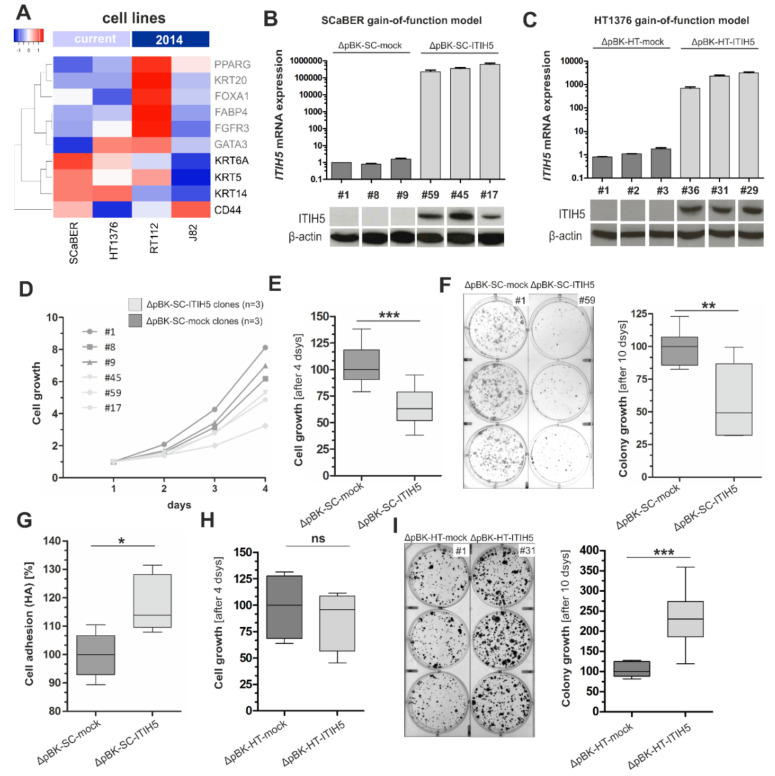
Figure 3.
Basal-type bladder cancer cell lines overexpressing ITIH5: Tumor and colony growth are impaired whereas cell adhesion on HA is facilitated by ITIH5 overexpression in CD44high SCaBER cells. (A) mRNA expression (TCGA data set) of selected luminal (gray) and basal-type (black) markers including CD44 in bladder cancer cell lines used in this (SCaBER and HT1376) and our previous ITIH5 study (RT112 and J82, see [20]). SCaBER and HT1376 cells express basal-type markers in a comparable manner except for CD44: While SCaBER cells show abundant CD44 expression (denoted CD44high), HT1376 cells exhibit low CD44 (denoted CD44low). Please note: Expression level does not reflect absolute expression values—only a relative expression value is given by array-based data—and variants of CD44 are also not considered. (B,C) ITIH5 gain-of-function models of basal bladder cancer lines based on (B) SCaBER and (C) HT1376: Specific ITIH5 mRNA overexpression in stable SCaBER (ΔpBK-SC-ITIH5) and HT1376 (ΔpBK-HT-ITIH5) single-cell clones were further confirmed by Western blotting compared to mock control clones. β-actin served as loading control. (D,E) XTT proliferation assay was performed. SCaBER ITIH5 single-cell clones showed reduced cell growth compared with ΔpBK-SC-mock controls. The baseline level optical density (OD) at 24 h was set to 1. (F) Long-term colony growth of basal SCaBER bladder cancer cells upon ITIH5 expression. Box plot presents averages of triplicate experiments based on three independent ScaBER ΔpBK-SC-ITIH5 and three ΔpBK-SC-mock clones. Left: Representative wells with grown ΔpBK-SC-ITIH5 as well as ΔpBK-SC-mock colonies are shown. Right: Densitometrical evaluation of colony growth after 10 days. (G) Cell-to-matrix adhesion of ΔpBK-SC-ITIH5 and ΔpBK-SC-mock clones on HA-substrate. (H) Short-term XTT proliferation assay was performed. HT1376 single-cell clones overexpressing ITIH5 did not show altered cell growth compared with ΔpBK-HT-mock controls after 96 h. (I) Long-term colony growth of basal HT1376 bladder cancer cells upon ITIH5 expression. Box plot presents averages of triplicate experiments based on three independent HT1376 ΔpBK-HT-ITIH5 and three ΔpBK-HT-mock controls. Left: Representative wells with grown ΔpBK-HT-ITIH5 as well as ΔpBK-HT-mock colonies are shown. Right: Densitometrical evaluation of colony growth after 10 days. ns: not significant, * p ≤ 0.05, ** p < 0.01, *** p < 0.001.

