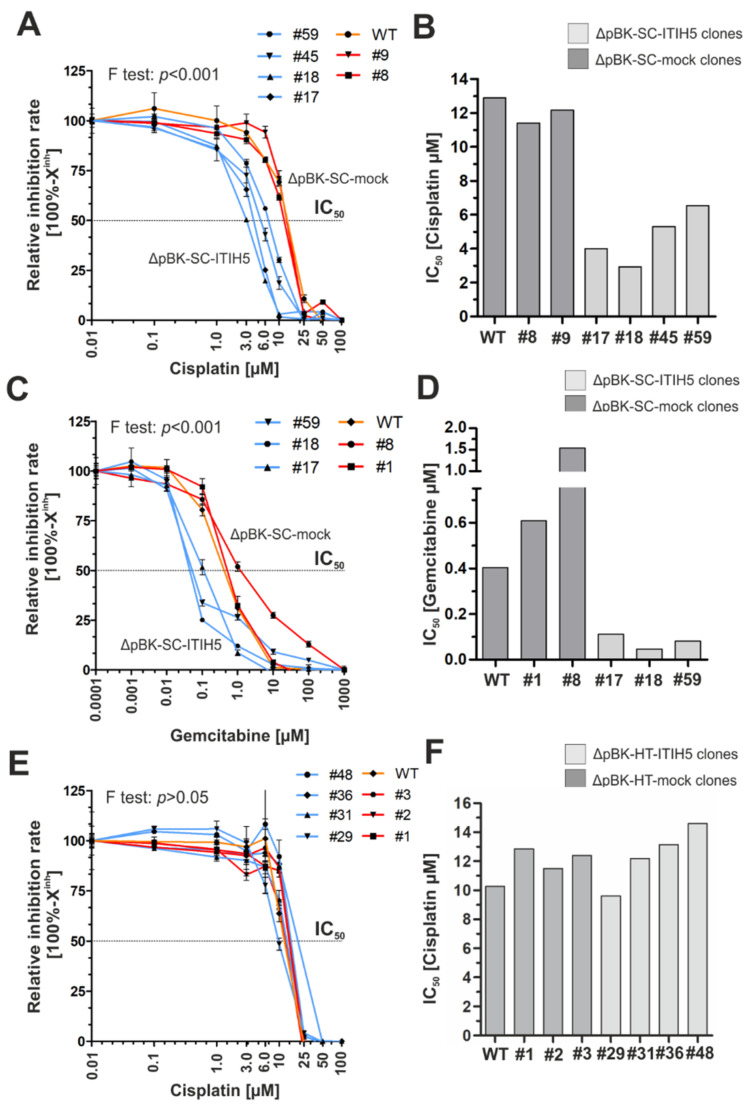
Figure 5.
ITIH5 expression sensitizes SCaBER cells to cisplatin and gemcitabine treatment in vitro. (A–C) Semi-logarithmic plots show drug response curves (relative inhibition rate = 100% − Xinh) for cisplatin and gemcitabine are shown. Drug response was determined using XTT following 72 h incubation with indicated drug concentrations. (A) Drug response of SCaBER WT (orange line), ΔpBK-SC-ITIH5 (blue lines) and ΔpBK-SC-mock (red lines) clones upon cisplatin treatment. (B) Drug response of SCaBER WT (orange line), ΔpBK-SC-ITIH5 (blue lines) and ΔpBK-SC-mock (red lines) clones upon gemcitabine treatment. (C) Drug response of HT1376 WT (orange line), ΔpBK-HT-ITIH5 (blue lines) and ΔpBK-HT-mock (red lines) clones upon cisplatin treatment. (D–F) Relative IC50 (drug concentration causing 50% inhibition) values are derived from the drug response curve to define the sensitivity of each single-cell clone and WT, respectively.

