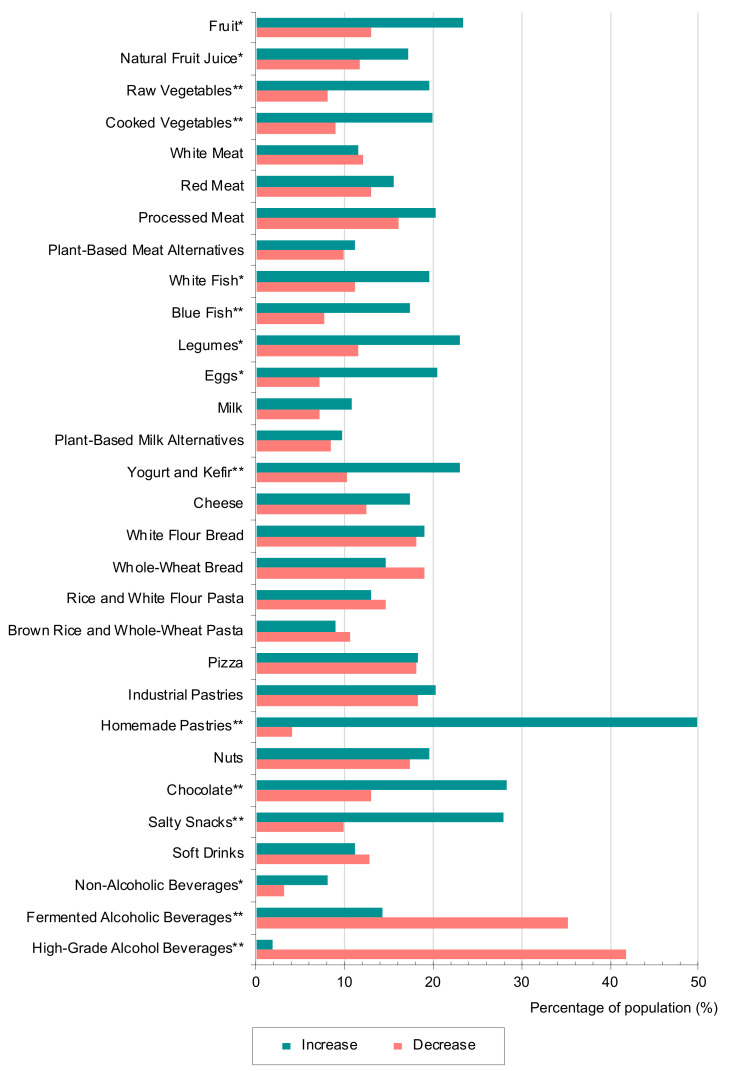
Figure 1.
Percentage of population that reported a variation (increase or decrease) in the intake of each foodstuff during COVID-19 lockdown. People who reported no change in frequency of consumption are not represented in this figure. Statistically significant differences between food intake before and during COVID-19 lockdown period were assessed by a Wilcoxon test and are indicated with asterisks (* p < 0.05; ** p < 0.01).

