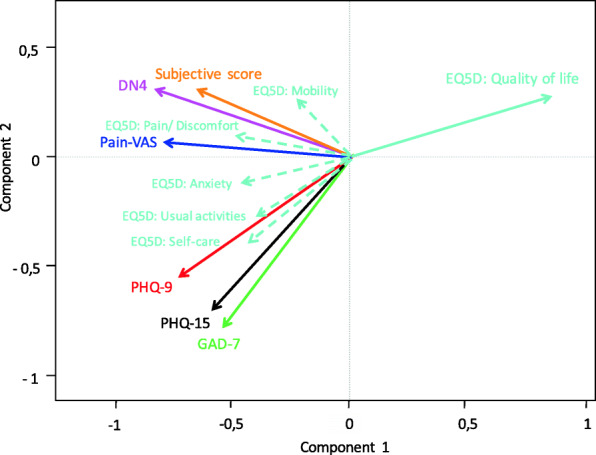
Fig. 4.

Biplot of subjective neurosensory measurements. The more similar the direction of two vectors, the stronger the correlation between these variables. A strong positive correlation suggests that the two questionnaires offer virtually the same information. This figure shows a negative correlation between quality of life and all other questionnaires. There is a strong positive correlation between Pain-VAS, DN4, and subjective score, as well as between PHQ-9, PHQ-15, and GAD-7 scores. Also, concerning the correlation between the individual questions for each questionnaire, those of the EQ5D-5 L scale where the least correlated with one another. However, these individual questions did correlate significantly with the other categorically related questionnaires, e.g., EQ5D-Pain correlated with DN4 and Pain-VAS, and EQ5D-Anxiety correlated with GAD-7 and PHQ-9 and -15. Therefore, the EQ5D-5 L can act as good screening questionnaire for assessing a patient’s subjective well-being
