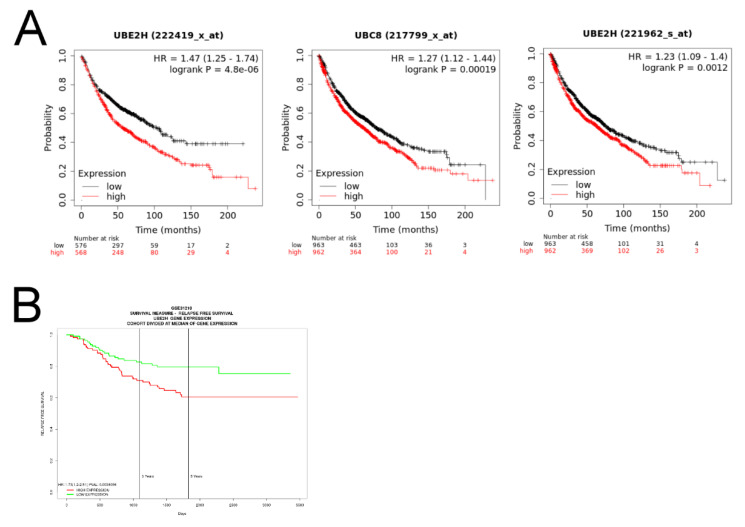
Figure 2.
The correlation of UBE2H expression and survival in patients with LUAD. (A) The survival analysis via the KM plotter. The samples are divided into high and low expressions according to median expression value of UBE2H. The red and black lines indicate high and low UBE2H expressions, respectively. Three plots are analyzed by the different probes labeled on each plot. (B) The survival analysis via GSE31210 dataset on SurvExpress. The red and green lines indicate high and low UBE2H expressions, respectively. HR—hazard ratios.

