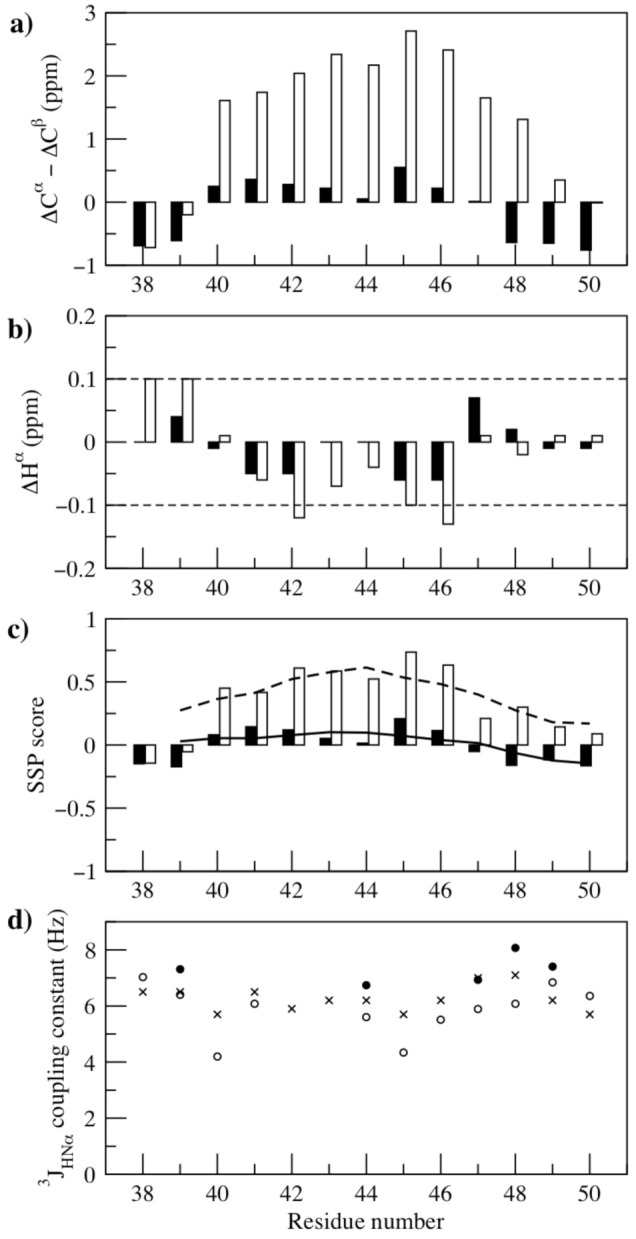
Figure 2.

Summary of the NMR data for the linker peptide. (a) Secondary shifts ΔCα-ΔCβ. (b) Secondary shifts ΔHα. (c) The Secondary Structure Propensities (SSP) scores. (d) The 3JHNα coupling constant values. In each panel the data for the linker peptide in water and in 50% TFE solution are shown with a filled and open bar or symbol, respectively. In panel b the dashed lines indicate the 0.1 ppm cut off usually used for secondary structure identification. In panel c the bars show the SSP scores without averaging and the solid and dashed lines show the SSP scores averaged over a 5-residue window for the peptide in water and 50% TFE solution, respectively. The predicted coupling constant values for a random coil, taking into account the character of the preceding residue, are indicated with an x symbol in panel d [26].
