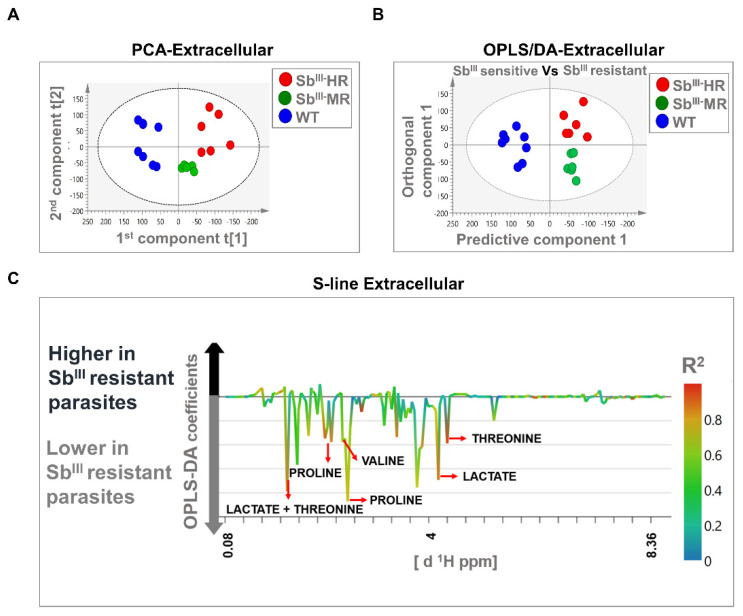
Figure 5.
Multivariate analysis showing significant differences in metabolomic profiles of sensitive and resistant Leishmania parasites at the extracellular level by 1H-NMR. (A) Score plot of PCA. (B) OPLS-DA score plot comparing antimony-resistant vs. antimony-sensitive parasites. (C) S-line plot highlighting the metabolites with major contributions to group separation. Each individual dot in panel (A) or (B) represents an observation or sample. Some dots can be overlapped. Blue dots: WT strain; green dots: MR strain; red dots: HR strain. The dotted ellipse of score plots describe the 95% confidence interval of the Hotelling’s T-squared distribution. The color bar in the S-line plot corresponds to the absolute value of the correlation loading in the discrimination model. A total of 20 observations or independent biological replicates are shown, 8 of them correspond to WT, 6 to MR, and 6 to HR group.

