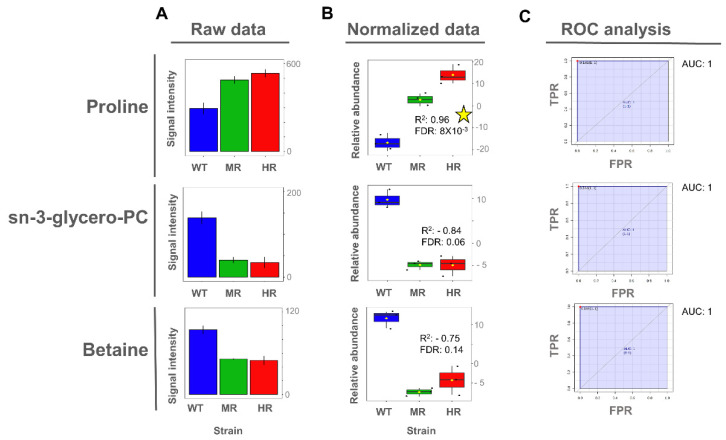
Figure 6.
Proline, glycerol-phosphocholine, and betaine as potential biomarkers of antimony resistance at the intracellular level. (A) Bar plot of metabolite concentration as the raw intensity values. (B) Box plot of metabolite concentration as the normalized intensity values and showing the Pearson correlation scores. (C) Univariate ROC analysis comparing SbIII-resistant (MR and HR) vs. -sensitive strains (WT). Coefficient of determination by Pearson correlation (R2). False discovery rate of the p-values obtained for the R2 score (FDR). Significant high correlations (FDR ≤ 0.05) are highlighted with a yellow star. Sensitivity or true positive rate (TPR). Specificity or false positive rate (FPR). Area under the curve for univariate ROC analysis (AUC).

