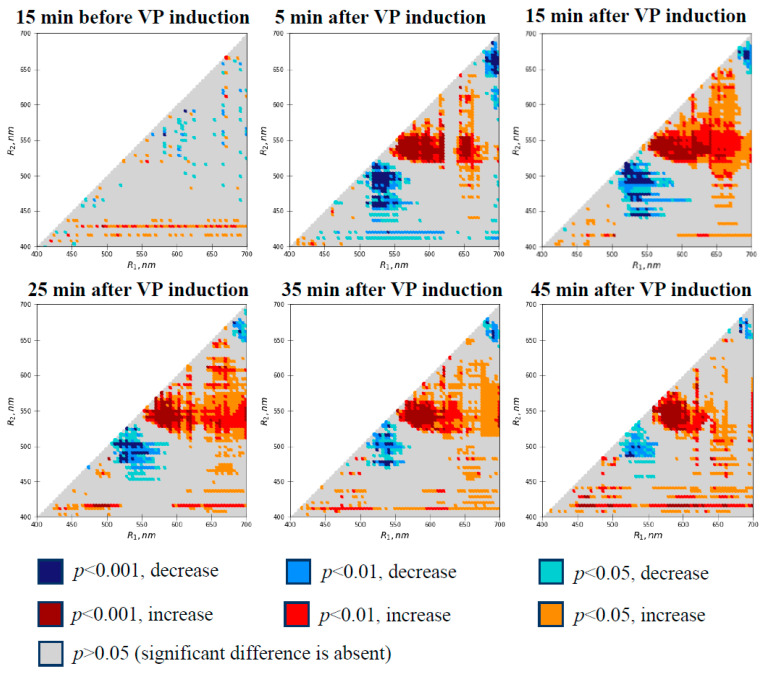
Figure 3.
Heat maps of significance and directions of changes in ΔRIs in the second pea leaf at different time intervals before and after induction of variation potential (n = 13). RIs were calculated based on Equation (1). Burning of the first leaf was used for VP induction. Each ΔRI was calculated as RITP–RIC. RIC is the control RI at 5 min before the VP induction. RITP is the difference in the reflectance index at a specific time point before or after VP induction. The Mann–Whitney U test was used for p-value calculations. The ΔRIs were compared to zero values (absence of changes). Using ΔRIs minimized the influence of individual plant differences on the local burning-induced changes in RIs.

