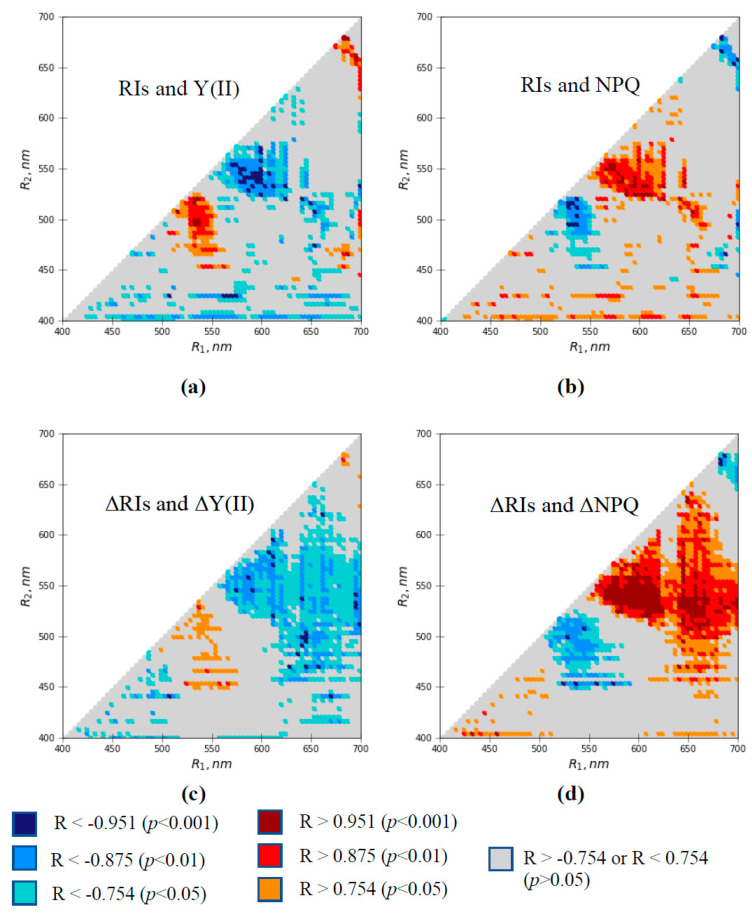
Figure 5.
Heat maps of linear correlation coefficients (R) between RIs and Y(II) (a), RIs and NPQ (b), ΔRIs and ΔY(II) (c), and ΔRIs and ΔY(II) (d). Pearson’s correlation coefficients were calculated based on medians of investigated parameters. The medians were calculated for each time point (n = 7). Only significant correlation coefficients are shown in the figure.

