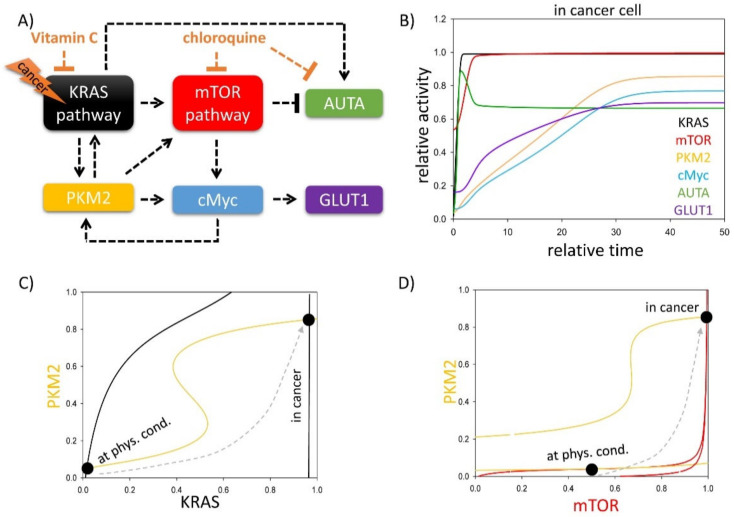
Figure 1.
Both KRAS and mTOR pathways have key roles in determining autophagy induction and GLUT1 transport upon various cellular stress events. (A) The key regulatory components and their interactions at various stress events. Autophagy refers to those elements which can induce autophagy with respect to cellular stress, while cell death inducer means the sum of the activators of cellular cell death process. Dashed lines show how the molecules can influence each other. Blocked end lines denote inhibition. (B) The computational simulations are determined in KRAS mutant cancer cells. The temporal dynamics are simulated with karas = 1. The relative activity of KRAS, PKM2, mTOR, cMyc, autophagy (AUTA) and GLUT1 is shown. The (C) PKM2–KRAS and (D) PKM2–mTOR signal–response curves are plotted in physiological conditions (karas = 0.1) and in cancer cells (karas = 1). Intersections of nullclines represent the stable (filled circle) steady states. Trajectories are depicted with dashed grey lines. For detailed descriptions of the elements and constants of the theoretical models, see Table A1 and Table A2, respectively.

