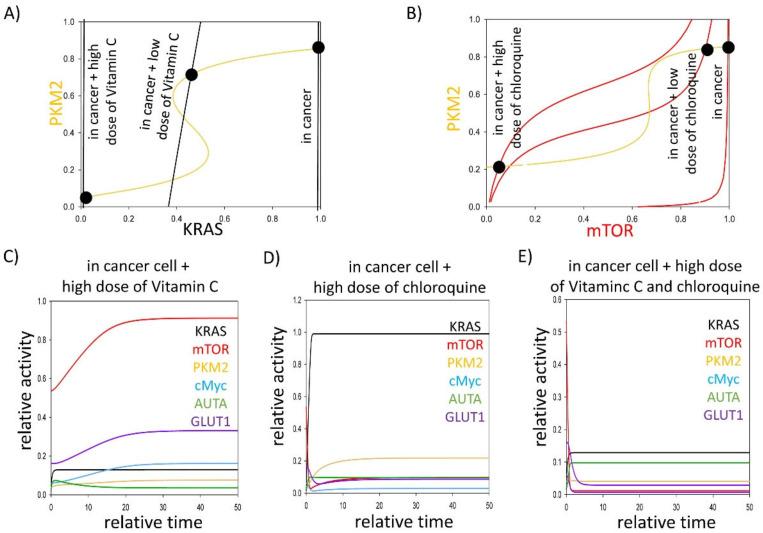
Figure 3.
Affecting either KRAS or mTOR pathways might have therapeutic roles in treating cancer cells. The (A) PKM2–KRAS and (B) PKM2–mTOR signal–response curves are plotted in cancer cells (karas = 1) combined with addition of various doses of (A) pharmacologic ascorbate (kiras’ = 1, kiras’ = 1.5) or (B) chloroquine (kimr’ = 1, kimr’ = 1.5). Intersections of nullclines represent the stable (filled circle) steady states. The computational simulations are determined in cancer cells (karas = 1) combined with the addition of (C) pharmacologic ascorbate (kiras’ = 1.5), or (D) during chloroquine treatment (kimr’ = 1.5, AUTAT = 0.1), or (E) in a combined treatment of pharmacologic ascorbate and chloroquine (kiras’ = 1.5, kimr’ = 1.5, AUTAT = 0.1). The temporal dynamics are simulated with karas = 1. The relative activity of KRAS, PKM2, mTOR, cMyc, autophagy (AUTA) and GLUT1 is shown. For detailed description of the elements and constants of the theoretical models, see Table A1 and Table A2, respectively.

