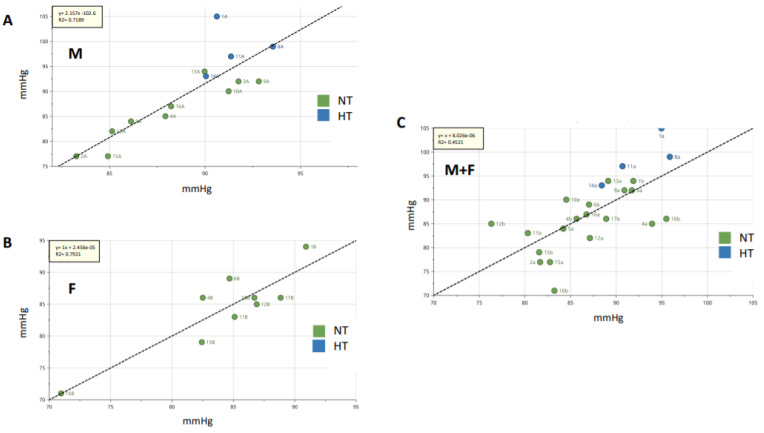
Figure 2.
Partial least square regression lines for stool metabolomes. The regression analysis highlighted a good linear correlation with 24 h MBP levels: (A) in the 2020 male (M) cohort (R2 = 0.72) and (B) in the 2020 female (F) cohort (R2 = 0.79). The correlation was less significant in the entire cohort (M + F) (R2 = 0.45, (C)). The X axis represents the predicted 24 h MBP values based on the fecal metabolomes and the Y axis represents the actual 24 h MBP values. The units for both axes are expressed in mmHg. The significance level was set for R2 ≥ 0.4.

