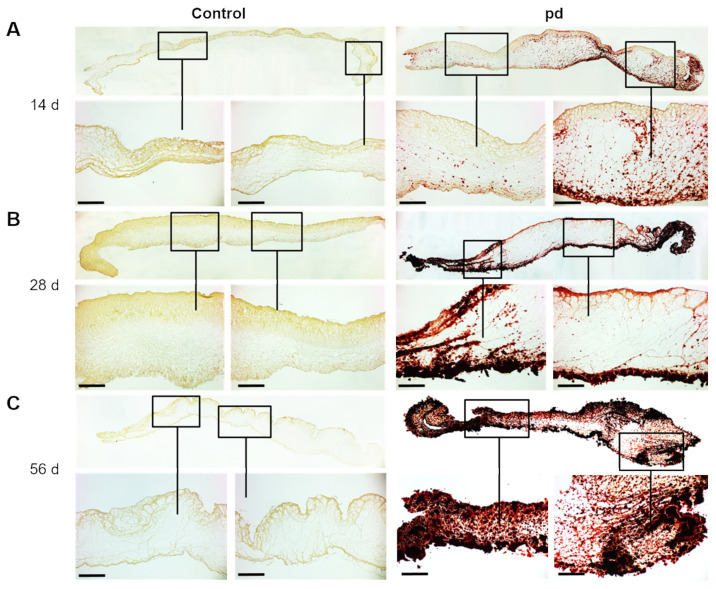
Figure 2.
Temporal progression of AV leaflet degeneration. Alizarin red S staining of AV leaflets under pro-degenerative (pd) conditions (β-GP + CaCl2) after 14 d (A), 28 d (B), and 56 d (C) compared to control conditions. Red indicates sites of biomineralization. Scale bar indicates 100 µm. Representative images of five different experiments are shown.

