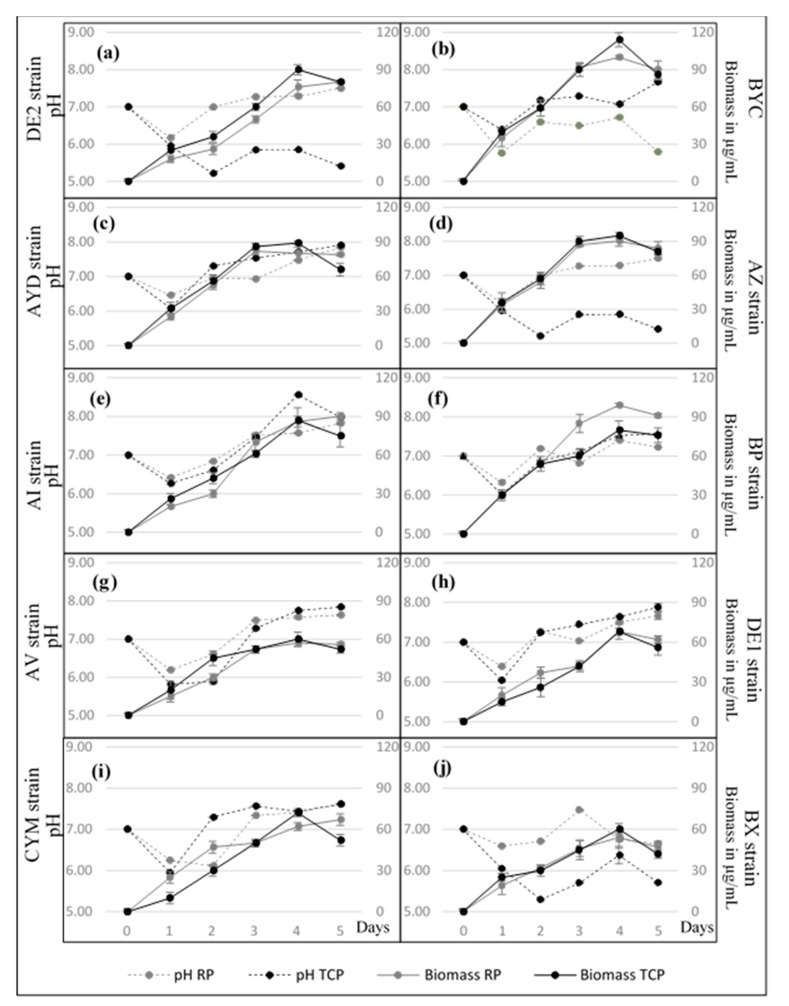
Figure 2.
Evolution of the biomass (continuous lines) and the pH of the medium (dotted lines) of the selected Actinomycete isolates grown in SMM+ TCP (black circle) and SMM+ RP (gray circle). Error bars represent standard deviations of the mean values of the results of three independent culture replicates.

