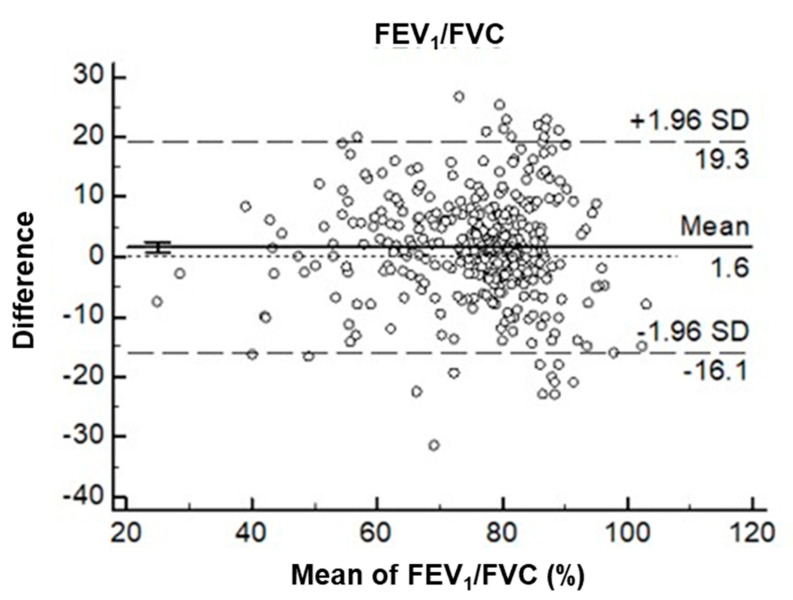
Figure 2.
Bland–Altman plots illustrating the differences between the prebronchodilator (pre-BD) forced expiratory volume in 1 s (FEV1)/forced vital capacity (FVC) values obtained using Spirobank Smart and the post-BD FEV1/FVC values obtained using the diagnostic spirometer as a percentage of the mean difference (vertical axis) versus the mean of the two FEV1/FVC ratios (horizontal axis).

