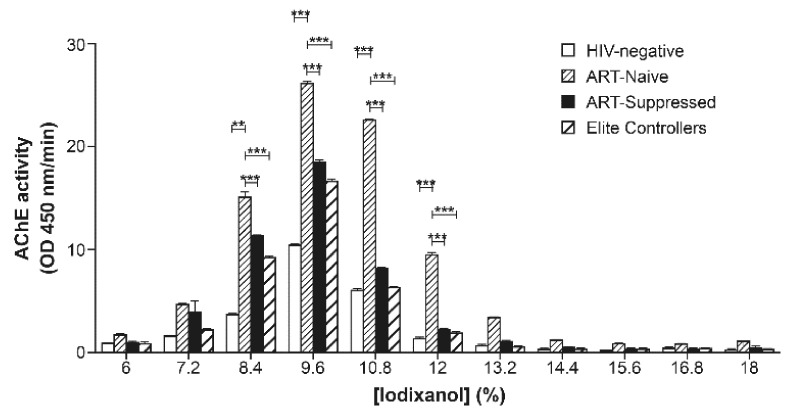
Figure 7.
Abundance of EVs in the plasma of HIV-1 patients. Plasmas from each group (HIV-1 negative, ART-naïve, ART-suppressed, and elite controllers) were pooled (n = 8), concentrated by ExoQuickTM, and resolved by ultracentrifugation on iodixanol velocity gradient. AChE activity was measured in each fraction. One-way ANOVA was used with the Tukey post-test. (** p < 0.01, *** p < 0.001).

