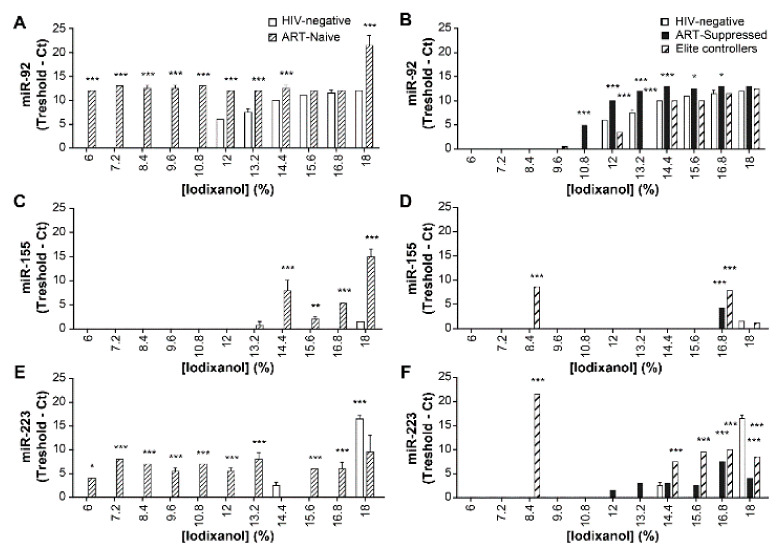
Figure 8.
Comparison of HIV-negative subjects and HIV-1 patients in terms of plasma EVs miR-92, miR-155, and miR-223 distributions in the iodixanol velocity gradient. Plasmas were pooled (n = 8 for each group) and pre-treated with proteinase K before EVs precipitation with ExoQuick™. MicroRNA in each gradient fraction was amplified by RT-PCR. Values are normalized as 38—Ct. HIV-1 negative versus ART-naïve (A,C,E) and HIV-1 negative versus ART-suppressed and elite controllers (B,D,F) were compared using two-way ANOVA and the Bonferroni post-test. Analyses were repeated at least two times (* p < 0.05, ** p < 0.01, *** p < 0.001).

