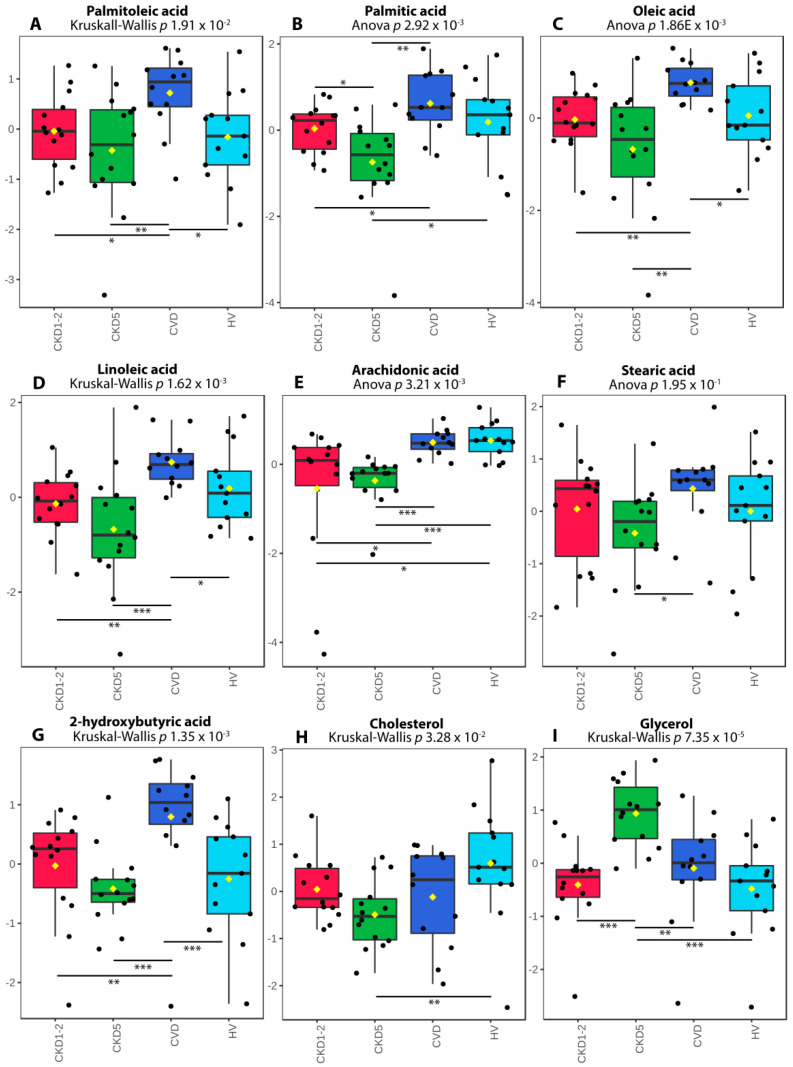
Figure 7.
The abundance of differentially accumulated fatty acids, cholesterol and glycerol revealed in GC-MS analysis. (A) Palmitoleic acid. (B) Palmitic acid. (C) Oleic acid. (D) Linoleic acid. (E) Arachidonic acid. (F) Stearic acid. (G) 2-hydroxybutyric acid. (H) Cholesterol. (I) Glycerol. A box on plot presents interquartile ranges and medians. The black dots represent the normalized accumulation of molecules in all samples. The notch indicates the 95% confidence interval around the median of each group. The mean level is indicated with a yellow diamond. Bars and asterisks show results of U-Mann–Whitney/t-test: * p < 0.05, ** p < 0.01, *** p < 0.001; n = 14 in each group.

