Figure 1.
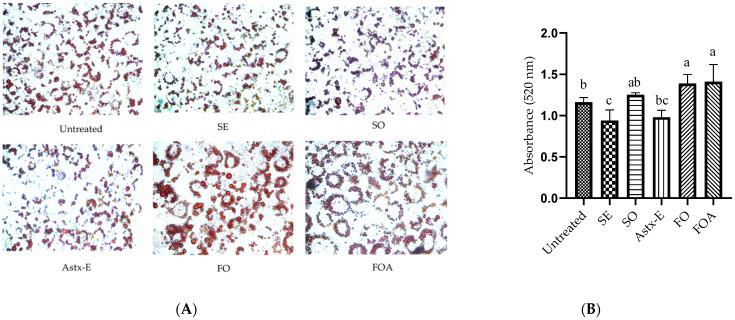
Shrimp extract decreased, while fish oil increased fat accumulation in 3T3-L1 mature adipocytes. Preadipocytes were differentiated to mature adipocytes in the presence or absence of various treatments for 8 days, and Oil Red O staining and quantification was performed as explained in the Methods section. (A) Representative images of the cells stained with Oil Red O on day 8 (400× magnification); (B) fat accumulation measured spectrophotometrically. Values are expressed as mean ± SD, n = 3. Data were analyzed using one-way ANOVA and Tukey’s post-hoc test; p < 0.05 was considered significant. Superscripts (a, b, c) represent significant differences. Untreated: Untreated cells; SE: Shrimp extract; SO: Shrimp oil; Astx-E: Esterified astaxanthin; FO: Fish oil; FOA: FO + Astx-E. Untreated vs. SE (p = 0.01); untreated vs. FO (p = 0.01); untreated vs. FOA (p = 0.01).

