
Figure 1.
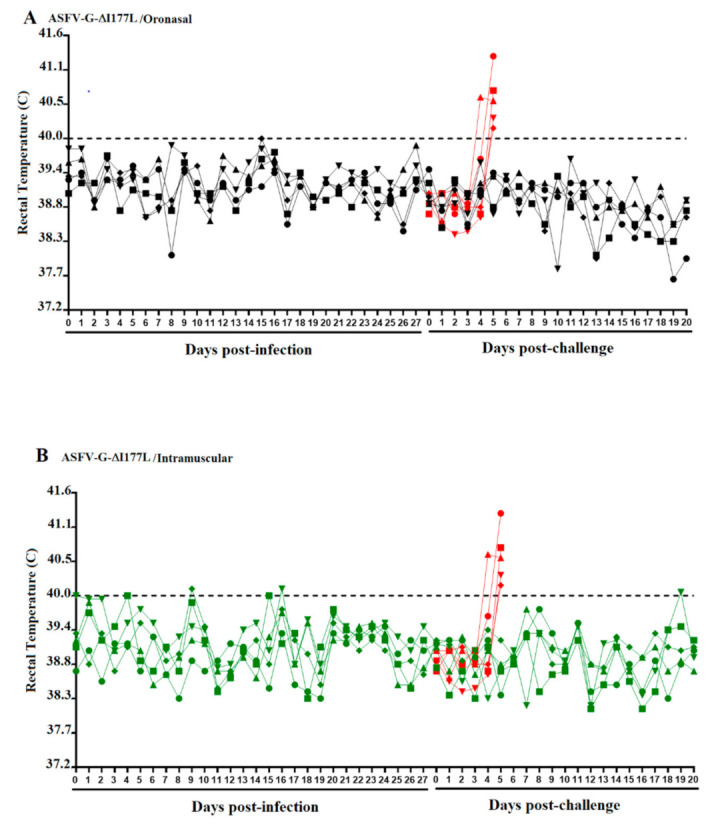
Kinetics of body temperature values in pigs oronasally (A) or intramuscularly (B) inoculated with ASFV-G-ΔI177L before (Days post-infection) and after challenge (Days post-challenge) with ASFV-G. Each curve represents individual data from each of the animals under each of the treatments. Red curves represent a group of mock-inoculated animals used as a control during both challenge experiments.