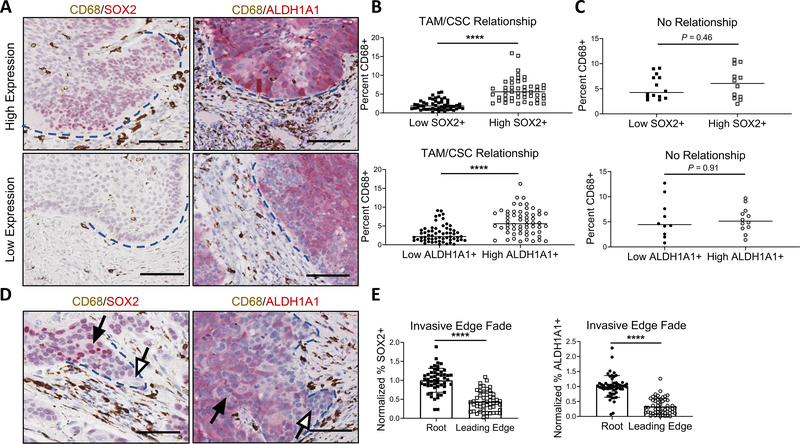
Figure 1. TAM presence at non-invasive and invasive edges correlates with altered CSC marker expression.
(A) Representative images (20x) of high SOX2 and high ALDH1A1 (top) and low SOX2 and low ALDH1A1 (bottom) regions (red) with associated TAM presence (CD68, brown). Blue dashed lines indicate rounded, non-invasive tumor edge. (B) Regions with high SOX2 (top) and high ALDH1A1 (bottom) expression contained significantly higher TAM presence (n = 28 patient cases). (C) No relationship between TAM presence and SOX2 (top) or ALDH1A1 (bottom) observed in remaining cases (n = 6 patient cases). (D) Invasive edge representative images of SOX2 (left) or ALDH1A1 (right) with associated TAM presence. Blue dashed lines indicate projecting tumor edge. White arrows point to faded leading edge and black arrows point to corresponding “root”. (E) Quantified drop in SOX2 (left) and ALDH1A1 (right) expression at leading edge compared to root (n = 20 patient cases). Quantification was done using Aperio ImageScope v12.3 software. ****P<0.0001, 2-tailed unpaired Student’s t test. (A, D) Scale bars: 100μm.

