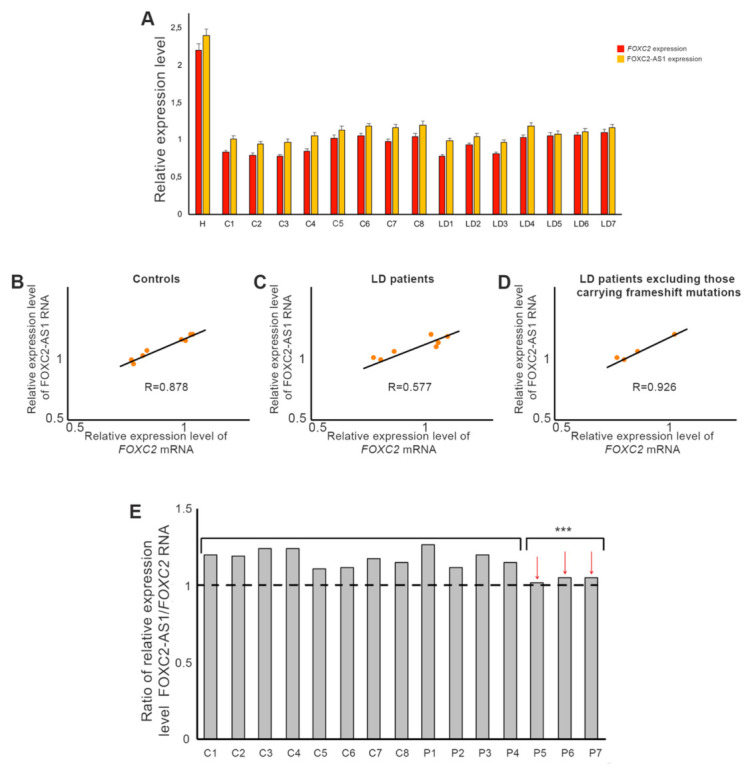
Figure 2.

FOXC2 and lncRNA FOXC2-AS1 expression in control and LD blood samples. (A) Real time PCR analysis of FOXC2 and lncRNA FOXC2-AS1 RNA in healthy (C1–C8) and LD (P1–P7) subjects. HeLa cells (H) were used as positive controls. GAPDH was used as a housekeeping gene to normalize the expression levels. Each bar represents mean of three independent experiments. (B) Pearson correlation analysis between FOXC2 and FOXC2-AS1 expression levels observed in control subjects (correlation coefficient R = 0.878, p < 0.05), in all LD patients (C) (correlation coefficient R = 0.577, p < 0.05) and in LD patients carrying FOXC2 missense and nonsense mutations (D) (correlation coefficient R = 0.926, p ≤ 0.001). (E) Ratio of lncRNA FOXC2-AS1 and FOXC2 expression levels in controls and LD subjects. Patients carrying frameshift mutations were indicated by arrows. Statistical analysis was performed using Kruskal–Wallis test. *** p < 0.05.
