
Figure 1.
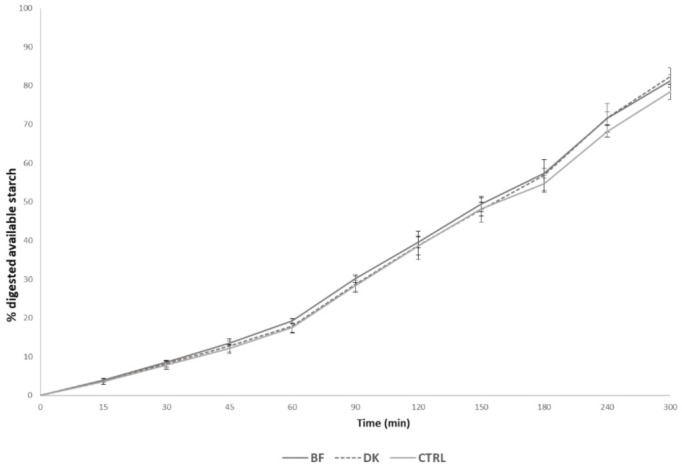
Lines represent the digested starch reported as a percentage of the total available starch during the in vitro digestion of each test food. Values are reported as the mean ± standard deviation (SD) (n = 3). BF: pasta produced by enriching semolina with a durum wheat bran fraction; CTRL: control, pasta produced by traditional milling; DK: pasta produced by using micronized debranned kernels. Statistical analysis was performed via one-way ANOVA and Bonferroni post hoc testing (p < 0.05).