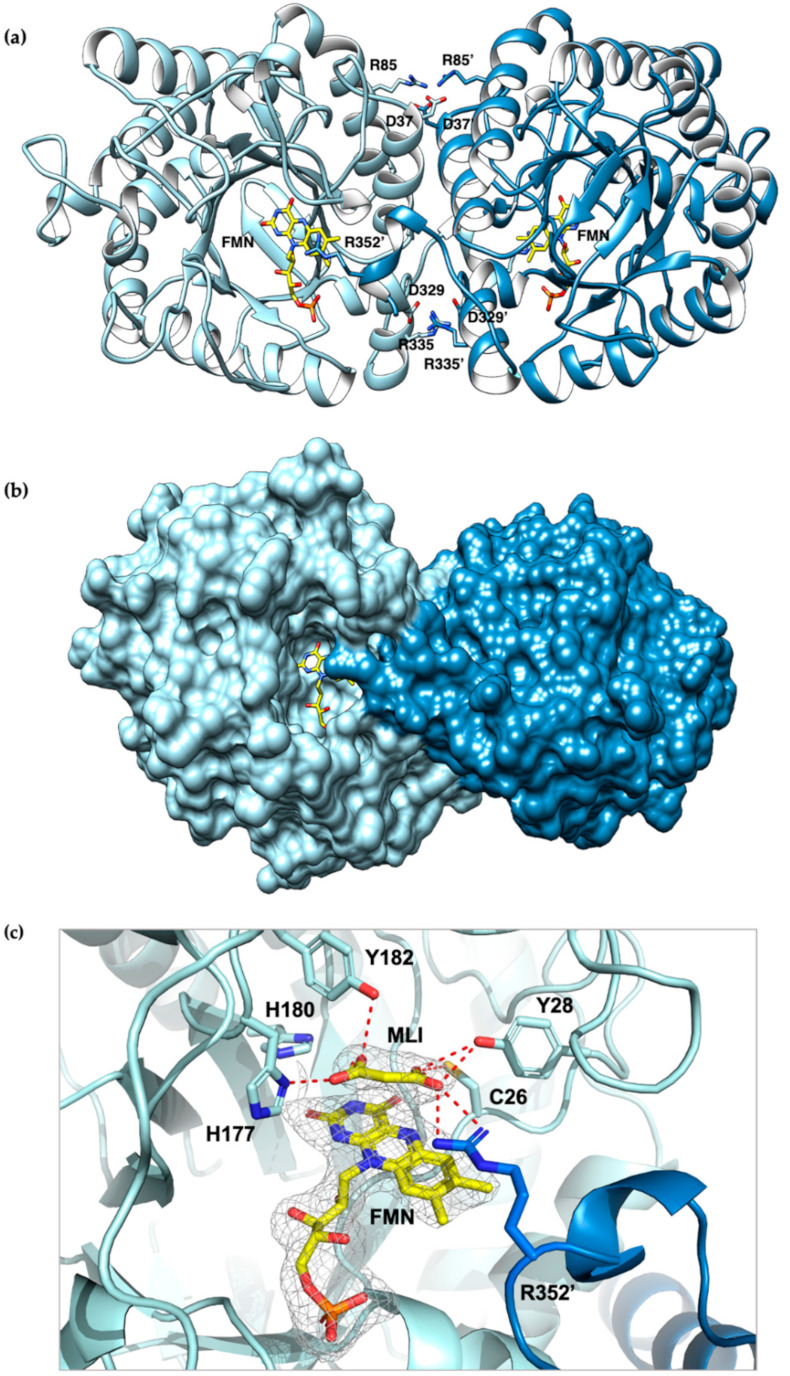
Figure 3.

Cartoon representation of the crystal structure of CaOYE (PDB 7O0T): (a) ribbon diagram showing the interactions involved in the dimer interface formation, (b) surface representation (c) details of CaOYE active site: ligands omit map (FMN and malonate), for which the ligand residues had been omitted, has been calculated by Phenix and is shown contoured at 3 σ. The two monomers of CaOYE are colored in light blue and steel blue; FMN cofactor and malonate (MLI) bound in the active site are shown with C atoms in yellow; most relevant residues of the catalytic cavity are shown with light blue C atoms, red O and blue N. Hydrogen bonds are shown as red dashed lines.
