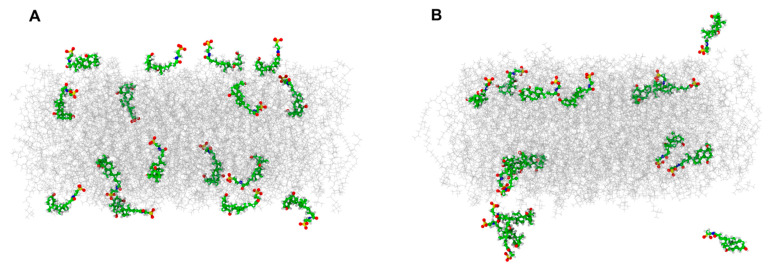
Figure 4.
MD simulation of TUDCA in the POPC membrane. (A)—start, 0 ns, (B)—end, 500 ns. Colors of atoms: red—oxygen, yellow—sulphur, blue—nitrogen and green—carbon. Water molecules are removed for clarity. Animation showing TUDCA molecules movement is provided as supplementary material (Animation S1).

