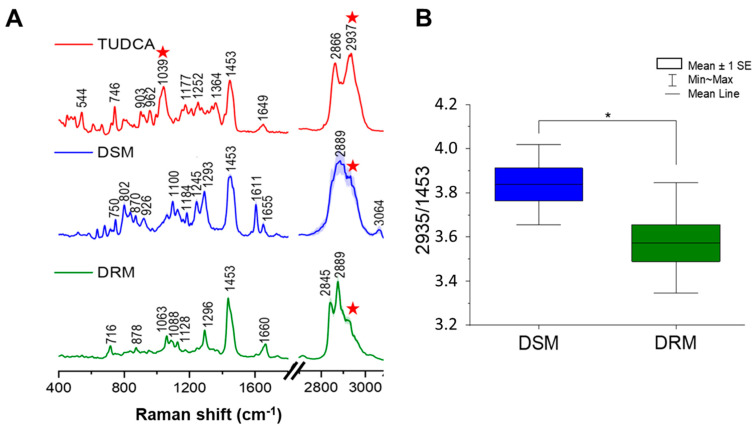
Figure 5.
(A) The comparison of the average Raman spectra of TUDCA standard (red) with average spectra of DSM (blue) and DRM (green) where the SD is presented as shadow. All intensities of the bands presented in the region of 400–1800 cm−1 were tripled comparing to the 2800–3100 cm−1 region in order to visualize low intensity bands of the fingerprint region. The bands at 1039 cm−1 and 2937 cm−1 or only at 2937 cm−1, characteristic of TUDCA, are marked with a red star in the Raman spectrum of TUDCA and DRM and DSM spectra, respectively. (B) The comparison of band ratio of 2937/1453 calculated for DSM and DRM providing the semiquantitative information about a higher concentration of TUDCA inside measured samples. Results are given as mean ± SE, data distribution is presented as box plots (mean value, mean ± SE, min–max whiskers). Data normality was assessed using the Shapiro–Wilk test. The significance of the differences between the band ratio for DSM and DRM was evaluated by a one–way ANOVA with Tukey’s test (* p < 0.05).

