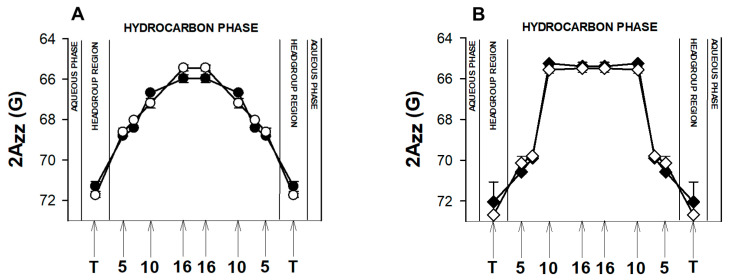
Figure 6.
Polarity profiles across POPC/DMPE membranes containing 5 (A) or 40 (B) mol% cholesterol. The spectra were acquired at 120 K. Upward changes of 2Azz indicate a decrease in polarity. Full symbols denote a control membrane and empty symbols—a membrane containing 5 mol% TUDCA. Approximate locations of the nitroxide moieties of spin labels are indicated by arrows.

