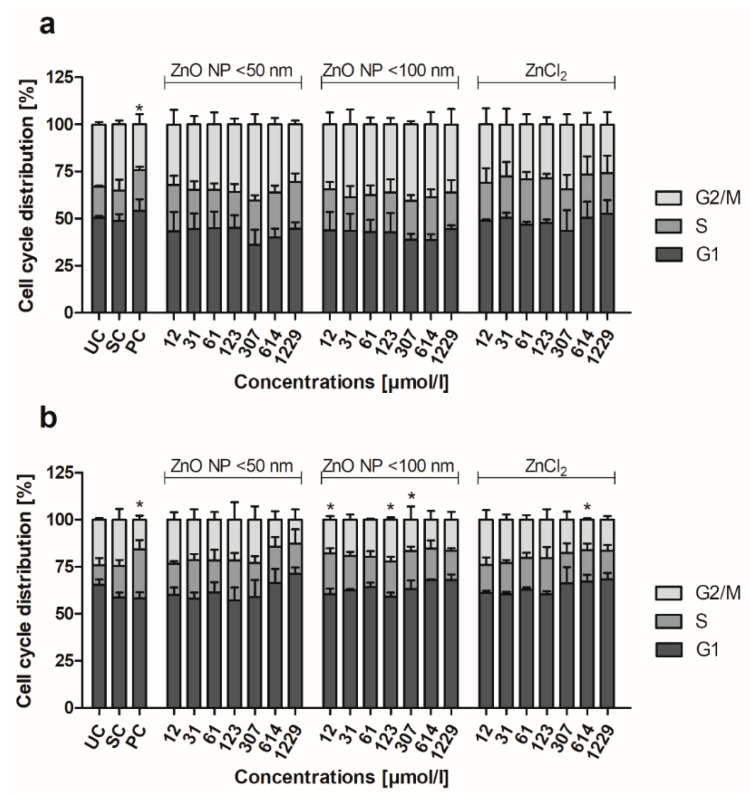
Figure 12.
Proportion of Caco-2 (a) and LT97 cells (b) in the G1, S, and G2/M cell cycle phases, after 24 h of treatment with ZnO NP < 50 nm, ZnO NP < 100 nm, or ZnCl2. UC: untreated control; SC: solvent control (Millipore water); PC: positive control (16 µM camptothecin). The data are expressed as the mean + standard deviation; n = 3. Significant differences compared to UC (* p ≤ 0.05) were obtained by one-way analysis of variance/the Ryan-Einot-Gabriel-Welsh post hoc test.

