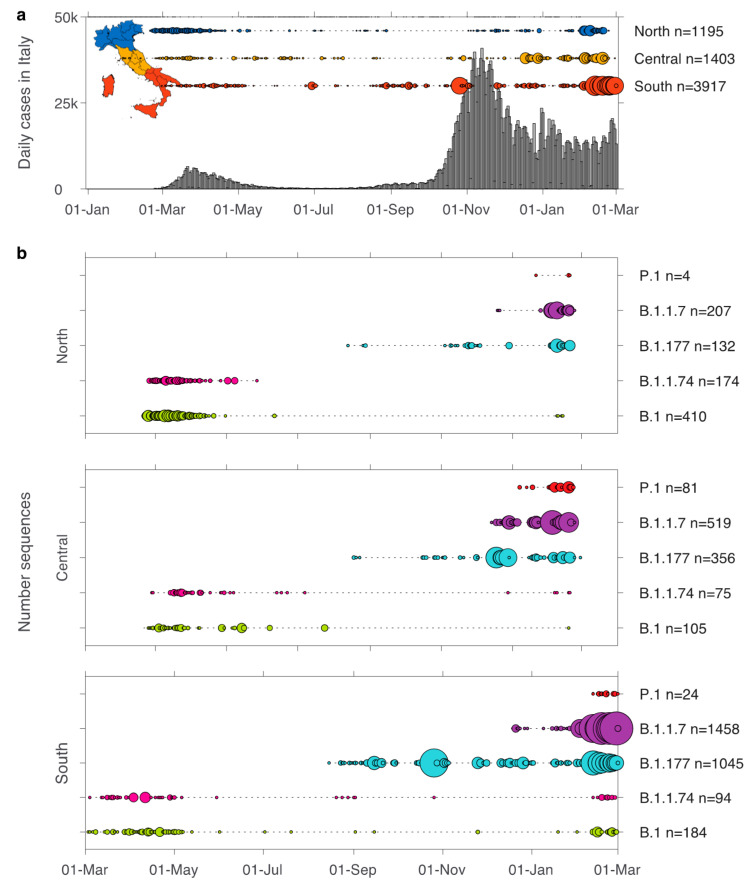
Figure 1.
Number of SARS-CoV-2 genomes sampled over time in Italy. (a) Bars show the number of cases reported in Italy between 1 January 2020–1 March 2021. Horizontally aligned circles show the number of sequences sampled for each day in North (blue), Central (yellow), South (red) Italy. The size of the circle is equivalent to the total number of sequences (max = 256). Italian regions are coloured according to their macro areas: blue = North (Valle d’Aosta, Piemonte, Liguria, Lombardia, Emilia-Romagna, Veneto, Friuli-Venezia-Giulia, and Trentino-Alto Adige), yellow = Central (Lazio, Marche, Toscana, Umbria, and Abruzzo), red = South (Puglia, Basilicata, Calabria, Campania, Molise, Sicilia, and Sardegna). (b) Number of sequences sampled in Italy for the lineages B.1. B.1.1.74, B.1.177, B.1.1.7, and P.1 for North (top), Central (middle), and South (bottom) Italy. The total number of sequences per day (circles) and the time range between first and most recent sequence (dotted line) is shown (max = 146).

