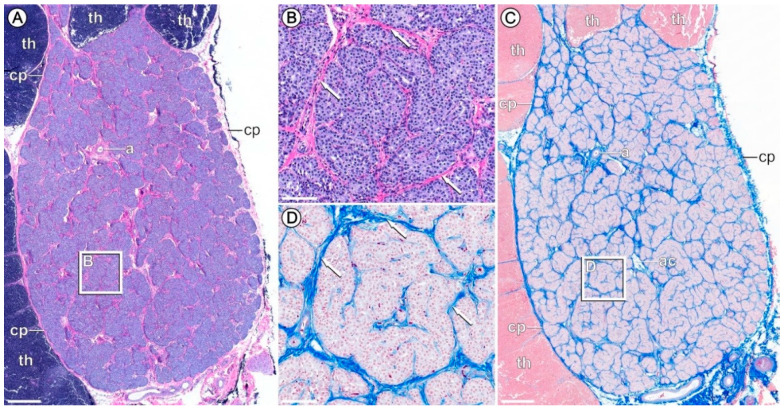
Figure 1.
Representative histological sections of a porcine parathyroid gland (PTG). (A,B) HE staining. (C,D) Azan trichrome staining. White rectangles refer to magnifications shown in (B,D). Arrows in magnified areas in (B,D) depict PTG parenchyma formed by chief cells. Clusters of chief cells are separated by collagenous septa (arrows). Scale bars: 500 µm (A + C), 100 µm (B + D). a—artery; ac—adipocytes; cp—capsule; th—thymus.

