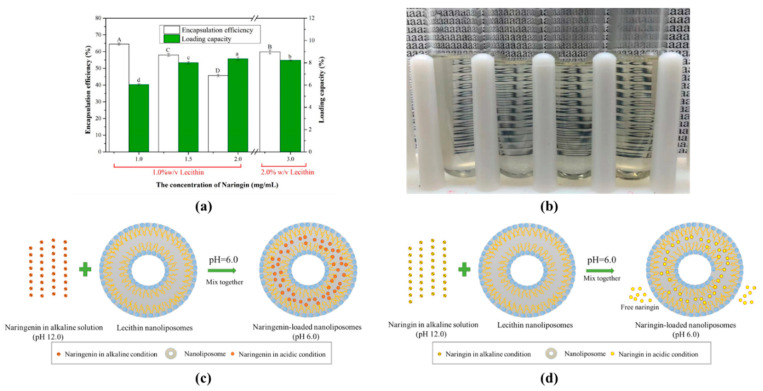
Figure 5.
Encapsulation efficiency and loading capacity (a) of naringin-loaded nanoliposomes with pH shift to 6.0; The image (b) of naringin-loaded nanoliposome solutions with naringin concentrations of 1.0, 1.5, and 2.0 mg/mL with 1% (w/v) lecithin, while naringin concentrations of 3.0 mg/mL with 2% (w/v) lecithin from left to right at pH 6.0. Schematic mechanism of the formation of naringenin-loaded (c) and naringin-loaded (d) nanoliposomes based on pH-driven method. Samples denoted with different letters (A–D) and (a–d) were significantly different (p < 0.05) in EE and LC when compared between different naringin levels, respectively.

