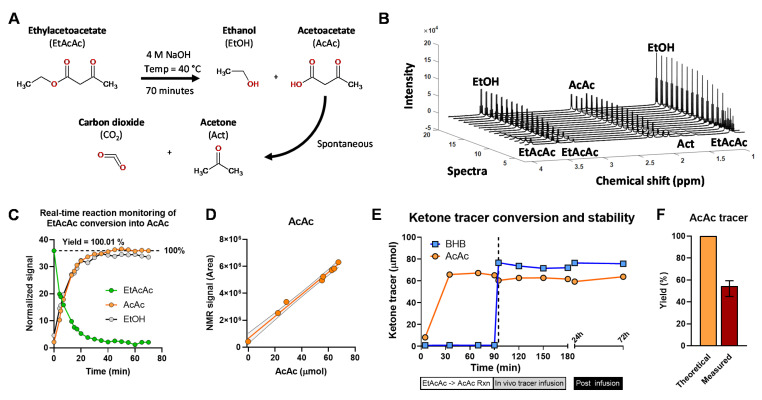
Figure 6.
Conversion of EtAcAc to AcAc and stability of AcAc tracer. (A) Hydrolysis of EtAcAc to AcAc and EtOH (B) Real-time reaction monitoring by 1H NMR. (C) Integrated 1H NMR resonances of EtAcAc, AcAc, and EtOH over time. (D) The relationship between AcAc detected using 1H NMR and an enzymatic assay. (E) Concentration of BHB and AcAc tracers during infusate preparation, double-tracer in vivo infusion in mice, and post-infusion. Dashed line denotes mixing of AcAc and BHB tracer solutions. (F) Measured AcAc tracer yield, data presented as mean and range.

